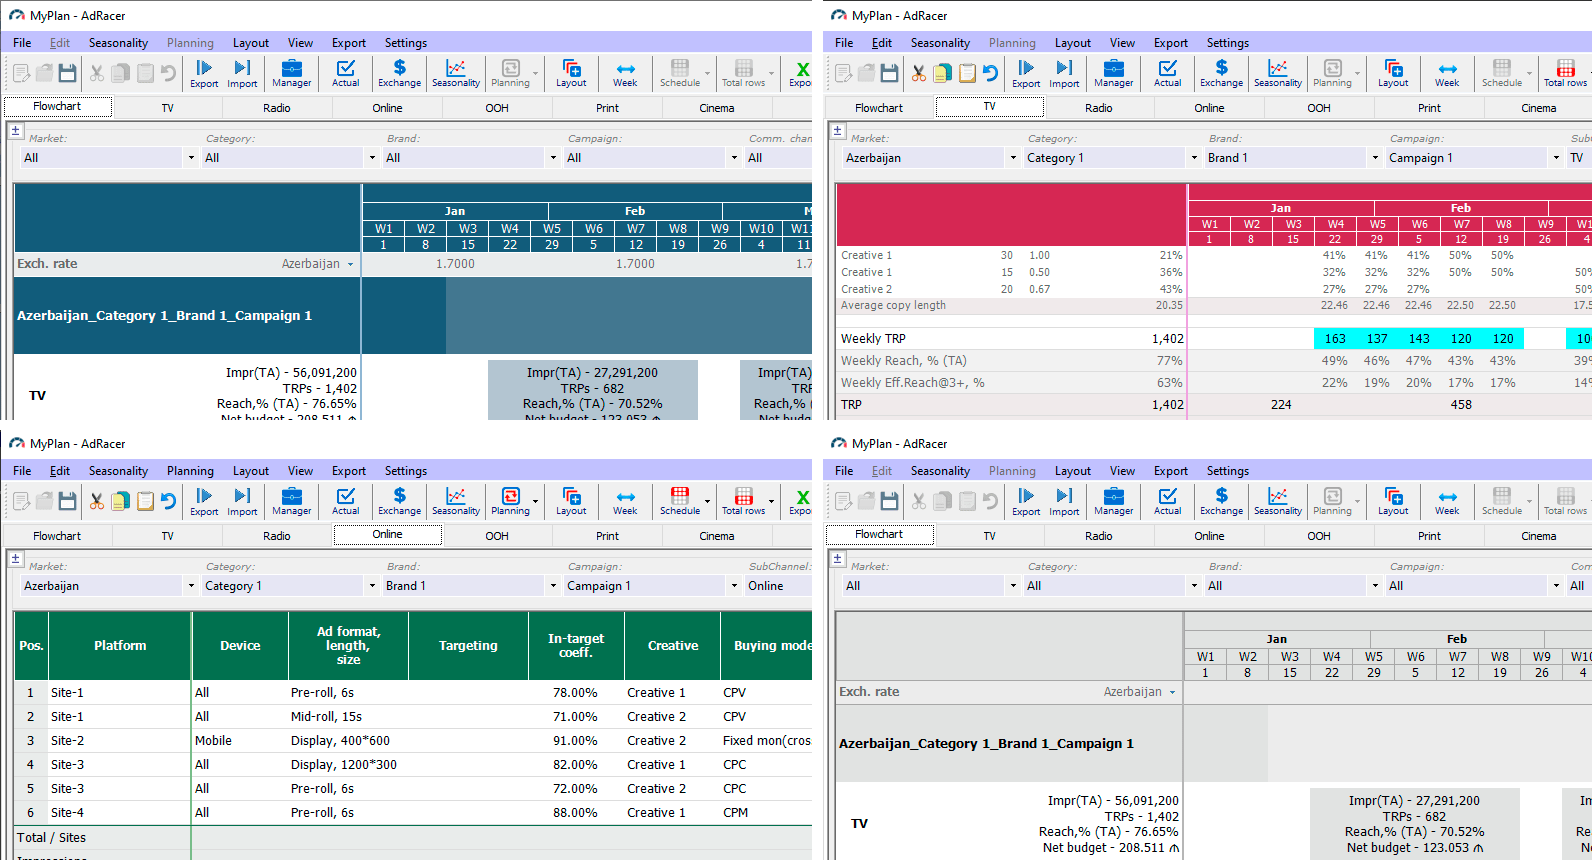
The application interface is implemented in a well-known style of Windows applications.
Key elements of the application main window:
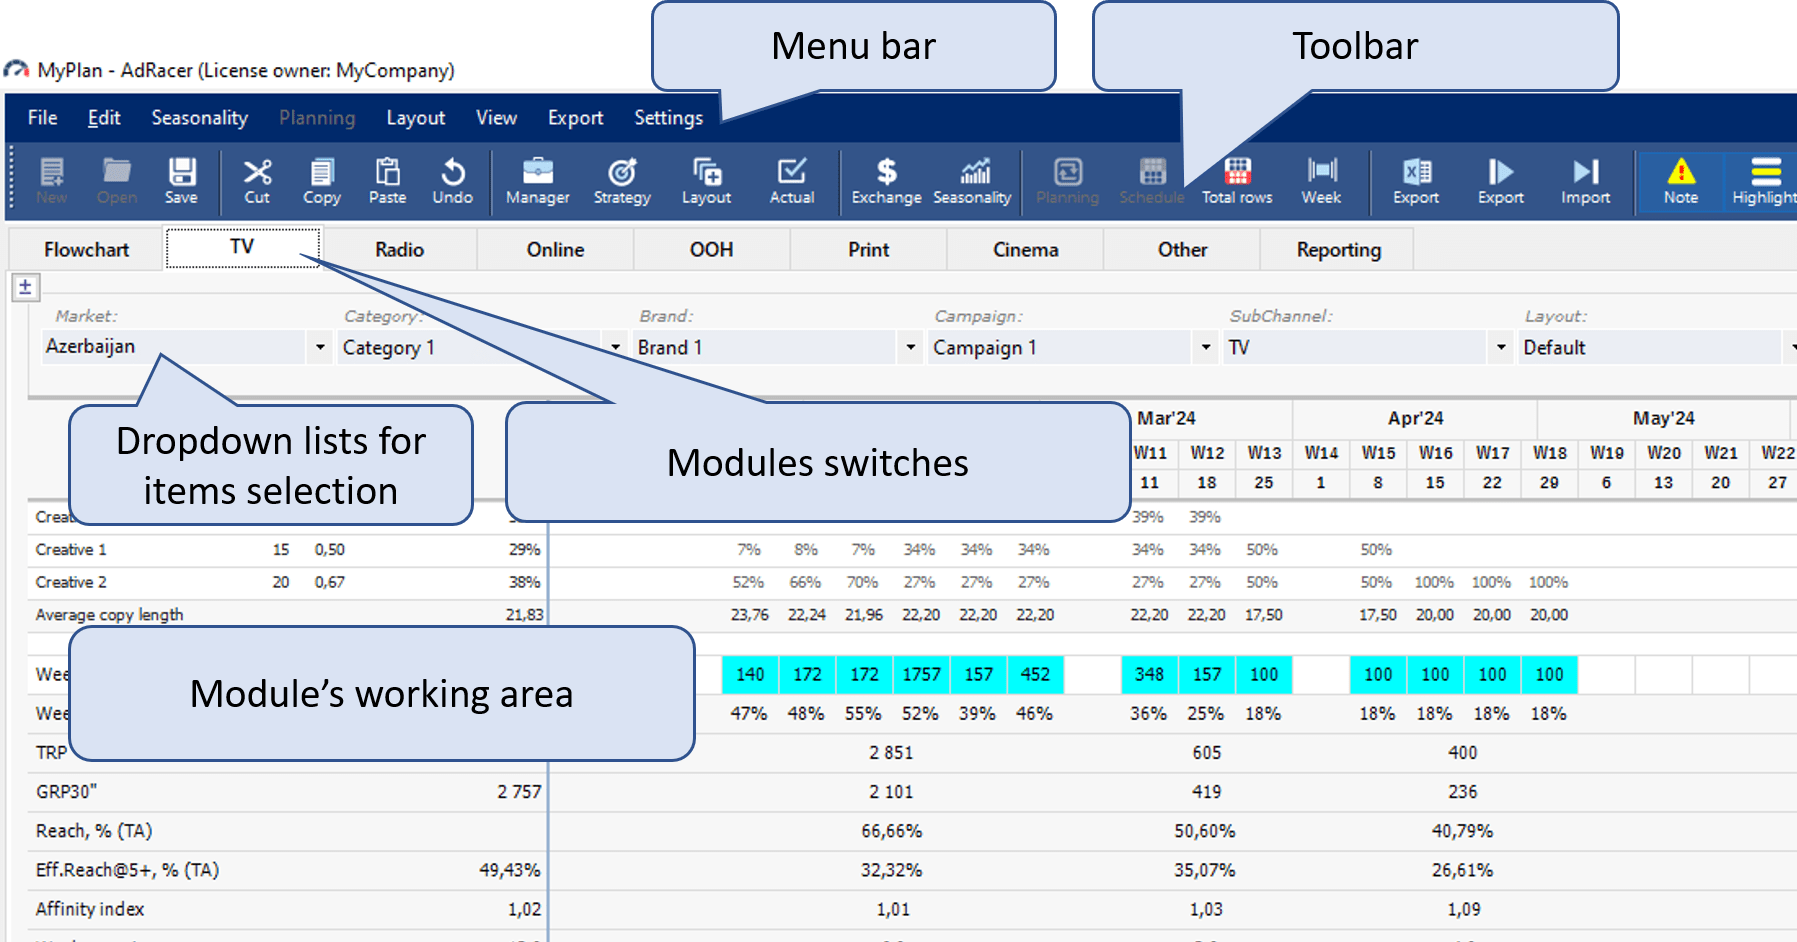
The element context menu is called by right-clicking on the element
1. Run the application and press New button on the toolbar (or select New project in File menu)
2. Choose a location for your project file in a regular file saving dialog, enter the project name and press Save
3. A New client dialog will appear. Enter the client name, select the activity period and press Apply
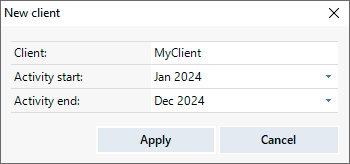
⚠ The activity period should last for 1 to 12 calendar months
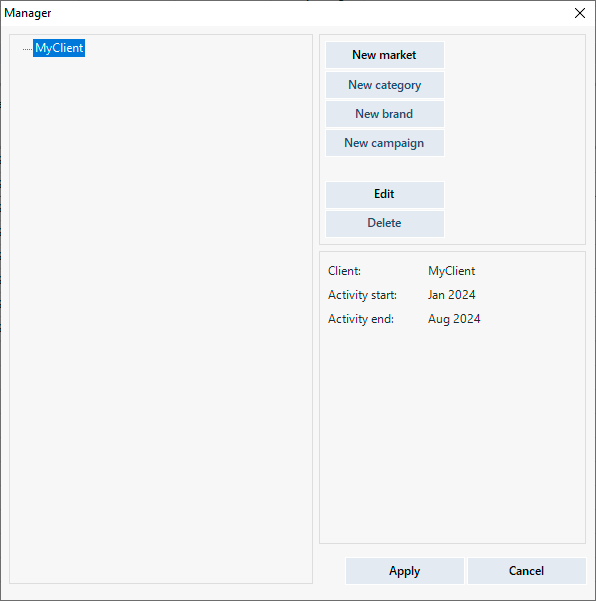
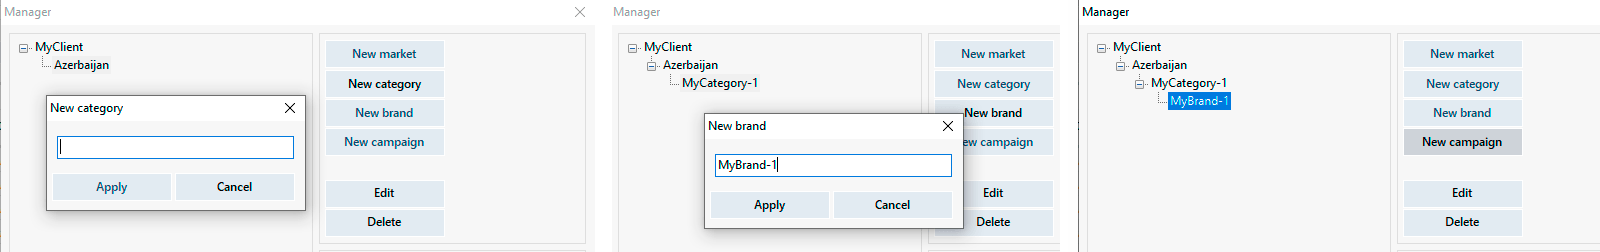
4. The left part of the Manager dialog will contain your client portfolio (markets, categories, brands, etc.) and the right part contains control buttons. Press New market.
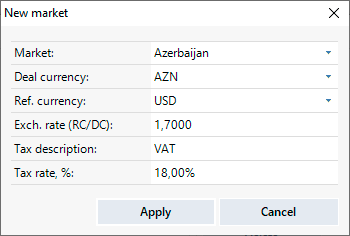
4. In the New market window, select a market (country) from the dropdown list. The auto-fill feature will suggest default values for the deal currency, reference currency, description of applicable taxes, and their rates, which you can change if necessary.
5. Enter the base (current) exchange rate of the reference currency to the deal currency and click Apply.
The created market will appear on the left side of the Manager window. Select the market and click the New category button.
6. Enter the category name and click the Apply button. Similarly, create a brand by selecting the created category in the tree and clicking New brand
7. Next, select the created brand in the tree and click the New campaign button
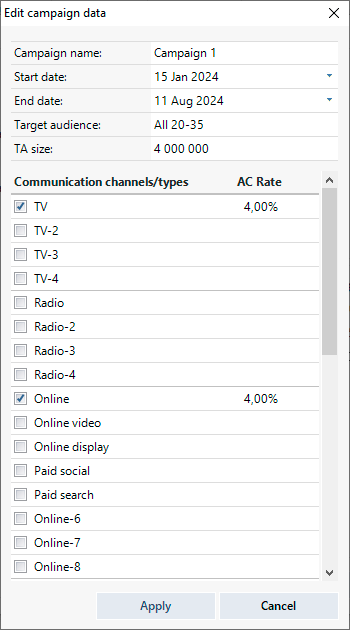
8. At the top of the New campaign window, enter the campaign name, change the period if necessary (by default, the program sets the campaign period according to the client's activity period), target audience, and its size, and at the bottom, select the communication channels (subchannels) used in the campaign, set the agency commission rates and click Apply.
⚠ The campaign name must be unique and should not be duplicated even for different brands, categories, or markets.
⚠ Subchannels are divided into groups - communication channels: for example, the first 4 subchannels belong to TV, the next 4 to radio, etc., and this division cannot be changed. However, you can freely change the names of the subchannels within the groups - for example, for the TV group, you can set subchannels like National TV, Regional TV, etc. The subchannel name cannot be empty and must be unique.
To create additional positions in the client's portfolio (markets, categories, brands, campaigns), in the Manager window, select the parent (higher) level for this position in the tree and click the New… button. For example, to add a brand to a category, select the category and click New brand, etc.
To edit existing positions, select the position and click the Edit button, to delete - Delete.
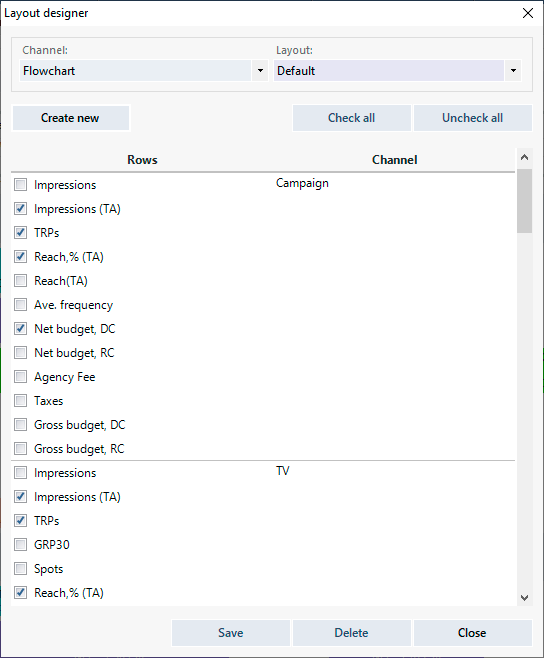
The application has predefined media plan formats for all communication channels and the flowchart. However, the users can create their own formats by adding the necessary set of indicators and metrics.
Click the Layout button on the application's toolbar, or select the Layout designer item in the Layout menu of the application's menu bar.
In the Layout designer window, select the desired communication channel, or the Flowchart item (if you are building a layout for the flowchart). The Layoutdropdown list reflects all predefined and user-created layouts (if any) for the selected channel. Predefined layouts cannot be edited, but you can build your own layout based on them, as well as on any other layout, by selecting it first.
Click the Create new button, enter the name of the new layout and press Enter.
Include the elements and metrics you need by ticking the checkbox next to them or, conversely, disable unnecessary ones by unchecking the box and click Apply.
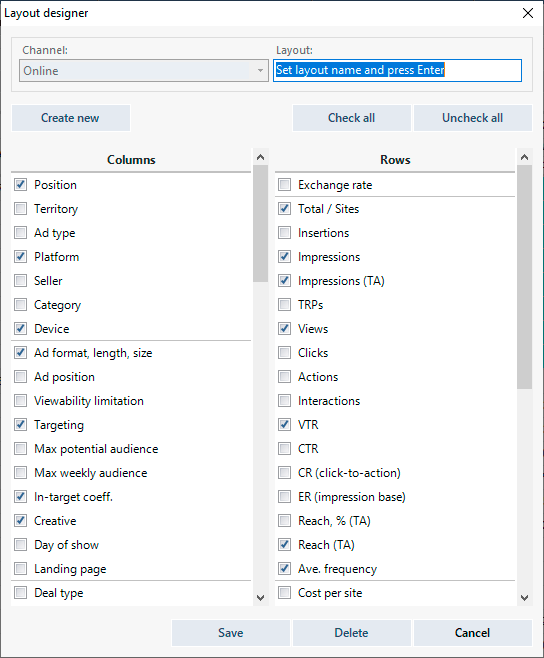
Now you can select the newly created layout from the Layout dropdown list in the corresponding module of the application, and the plan will be rebuilt according to this layout.
For non-TV media channels, the columns in the layout designer represent the columns in the media plan table, and the rows represent the total rows of the media plan.
For TV, only rows are available, as the TV plan table has fixed columns.
When building a layout for the flowchart, you can choose different sets of metrics for each media channel, for the campaign summary data, and for the entire flowchart summary data.
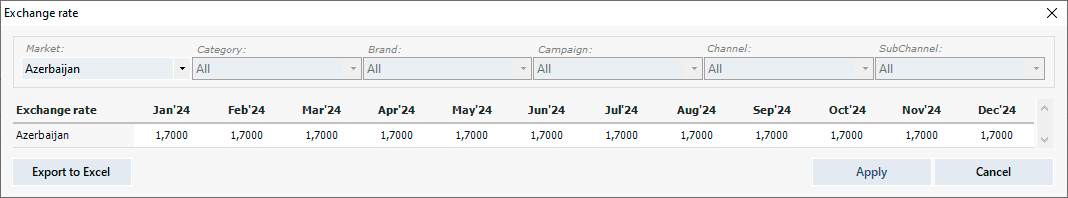
By default, the application applies the base exchange rate (entered by you when initializing the market) for the entire period of the client's activity. However, you can set an individual rate for each month.
Click the Exchange button on the application's toolbar, or select the Exchange rate item in the Seasonality menu of the application's menu bar.
In the Exchange rate dialog box, select the market (if there are a few ones) and set the exchange rates for each month:
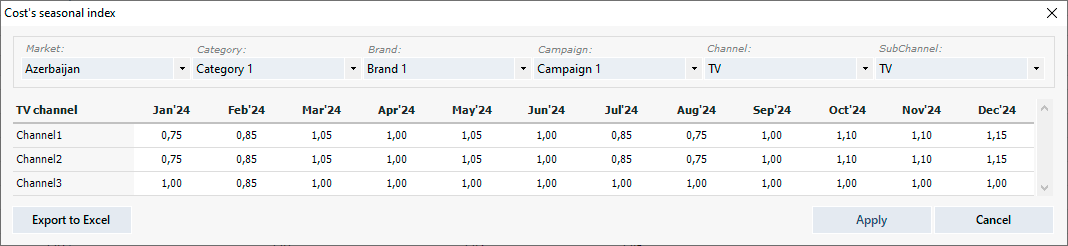
After creating a TV or non-TV media plan, you can set cost seasonal coefficients for each position of the media plan (TV channels, online platforms, etc.). By default, the application sets a seasonal coefficient of 1.00 for all months of the client's activity.
Click the Seasonality button on the application's toolbar, or select the Cost seasonal index item in the Seasonality menu of the application's menu bar. In the Cost seasonal index dialog box, select the market, category, brand, campaign, media channel, and subchannel (if there are a few ones) and set the monthly seasonal coefficients for each plan position:
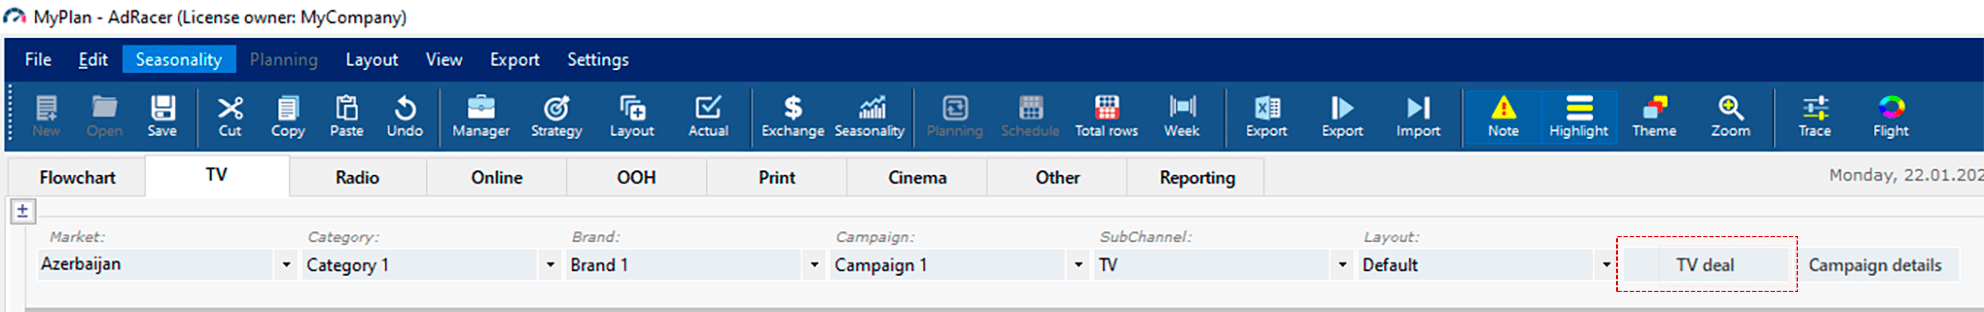
To plan TV campaigns, you first need to fill in the TV deal. Go to the TV module and click the TV deal button
1. In the TV deal window, select the market and the corresponding subchannel, buying model (GRP / minutes, default is GRP), buimg currency (default is the deal currency), split model (by budget / by GRP (or spots), default is by budget).
2. Enter the names of the channels, sales houses, and budget (or GRP) distribution in the columns Channel, Sales house, and Split:
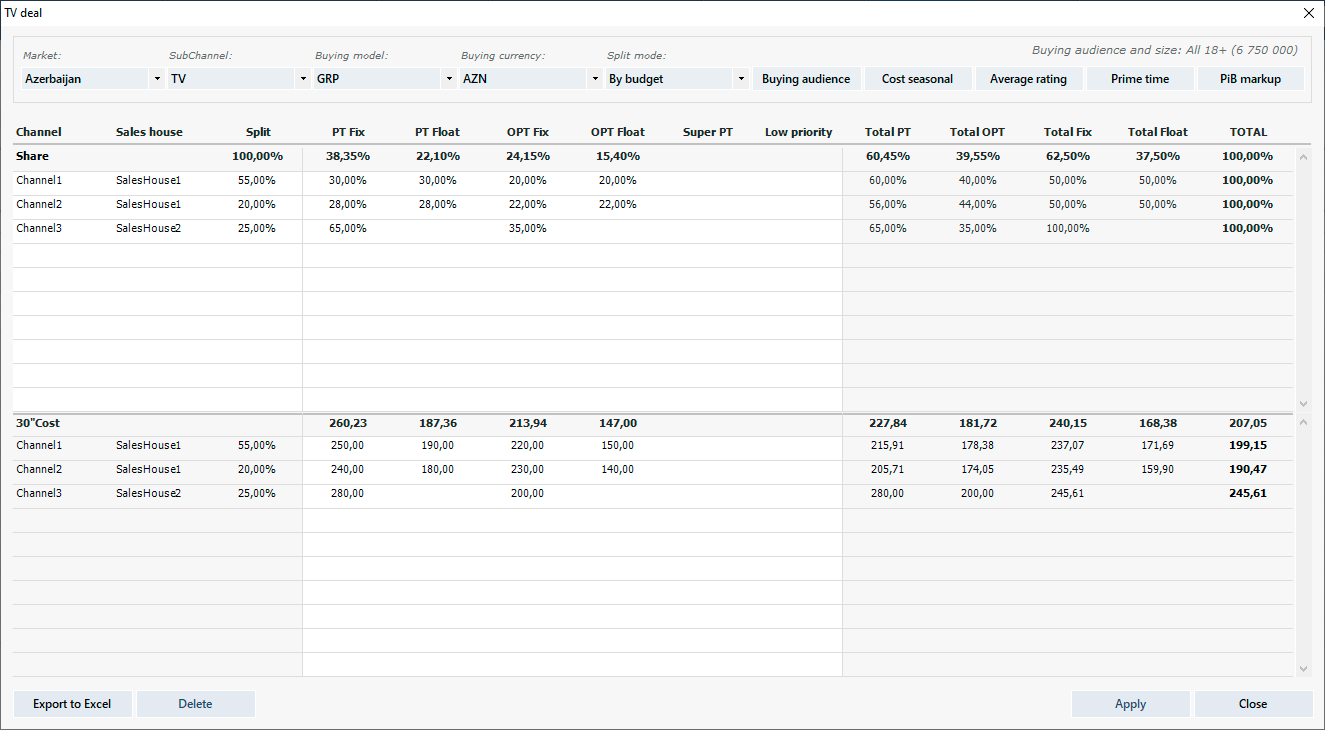
3. At the top of the table, fill in the deal configuration - prime and off-prime time shares, fixed and floating placements, and at the bottom - the prices for the used positions.
The total shares and prices for the positions, channels, as well as the total for the deal, are calculated automatically and displayed on the right side of the tables.
4. By clicking the buttons at the top of the TV deal window, you can call the corresponding dialogs for setting other deal and channel parameters:
- Buying Audience – setting the buying audience and its size (number of people in the general population)
- Cost seasonal index – seasonal coefficients (discounts and markups) to buying prices on channels by months
- Average rating – average rating in the buying audience by used time bands (necessary for calculating the number of spots in the plan, not mandatory to fill in)
- Prime time – defining prime time for weekdays and weekends
- PiB markup – markups for fixed positions in ad blocks
⚠ Before entering data for TV channels in the TV deal window, you need to enter the channel name, thereby activating the channel row in the table (otherwise, row editing is impossible).
⚠ The maximum number of TV channels in a deal is 20. Additional rows in the tables will appear automatically as needed. The created TV deal can be simultaneously used by multiple campaigns, brands, and categories of the client within the market for which it was created.
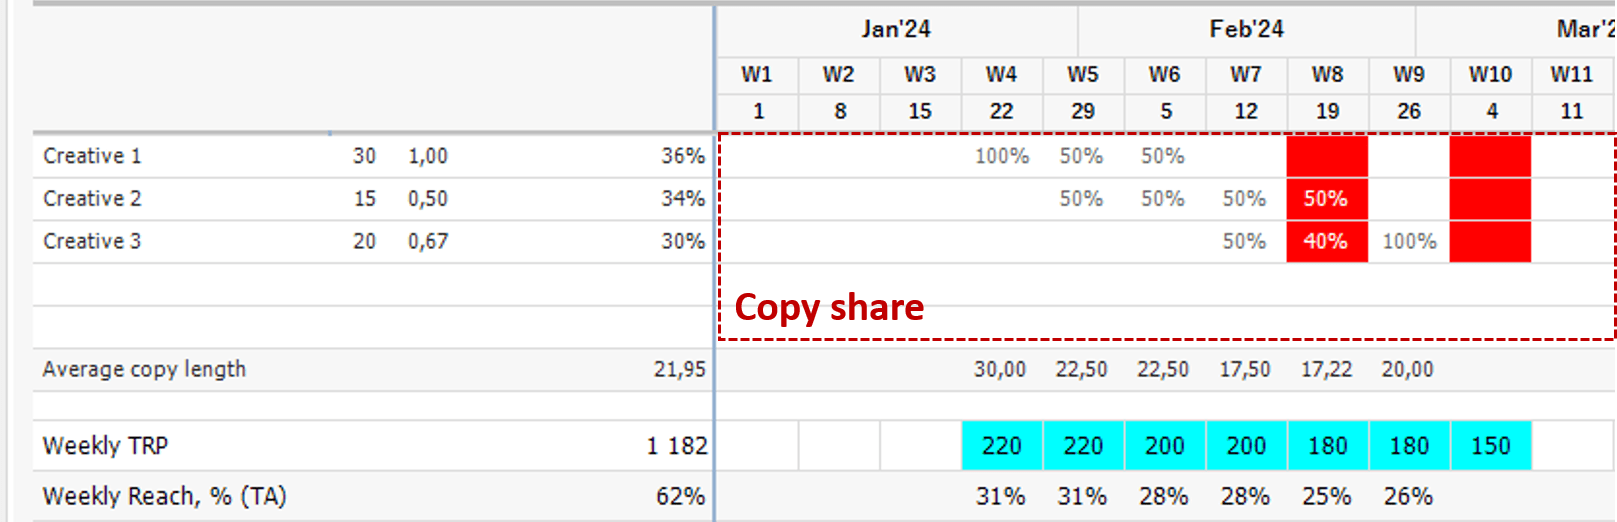
1. Switch to TV module. At the top of the TV plan, enter the names of the creatives (copies), their lengths (durations), and, if necessary, the price coefficients of the spot lengths. By default, the coefficient is proportional to the length of the spot and is calculated automatically when entering the spot length. If necessary, it can be changed manually. To display additional or hide unused copies rows, double-click on the empty area above the Creative name block. The maximum number of copies in a campaign is 5.
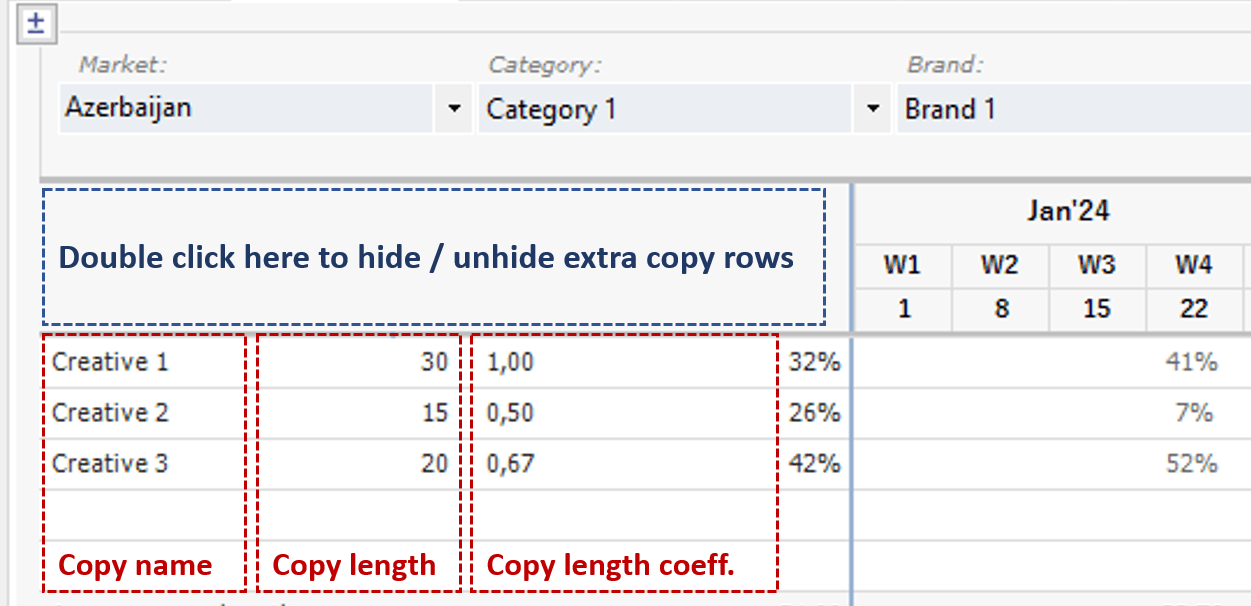
2. Enter the spot split in the Copy share block for each week. The total share of the spots should be 100%, otherwise, the program will signal an error in the Copy share block (as shown for week W6), and the total number of TRP will be calculated incorrectly.
3. Enter the weekly TRP. The entered value will be distributed according to the set copy split. If weekly TRP are entered for a period with unset copy split, the program will also signal an error (example - week W8):
⚠ Copy share input is only possible for initialized copies - you first need to enter the copy (creative) name, and only after that, you can edit its row.
Color Highlighting of Flights
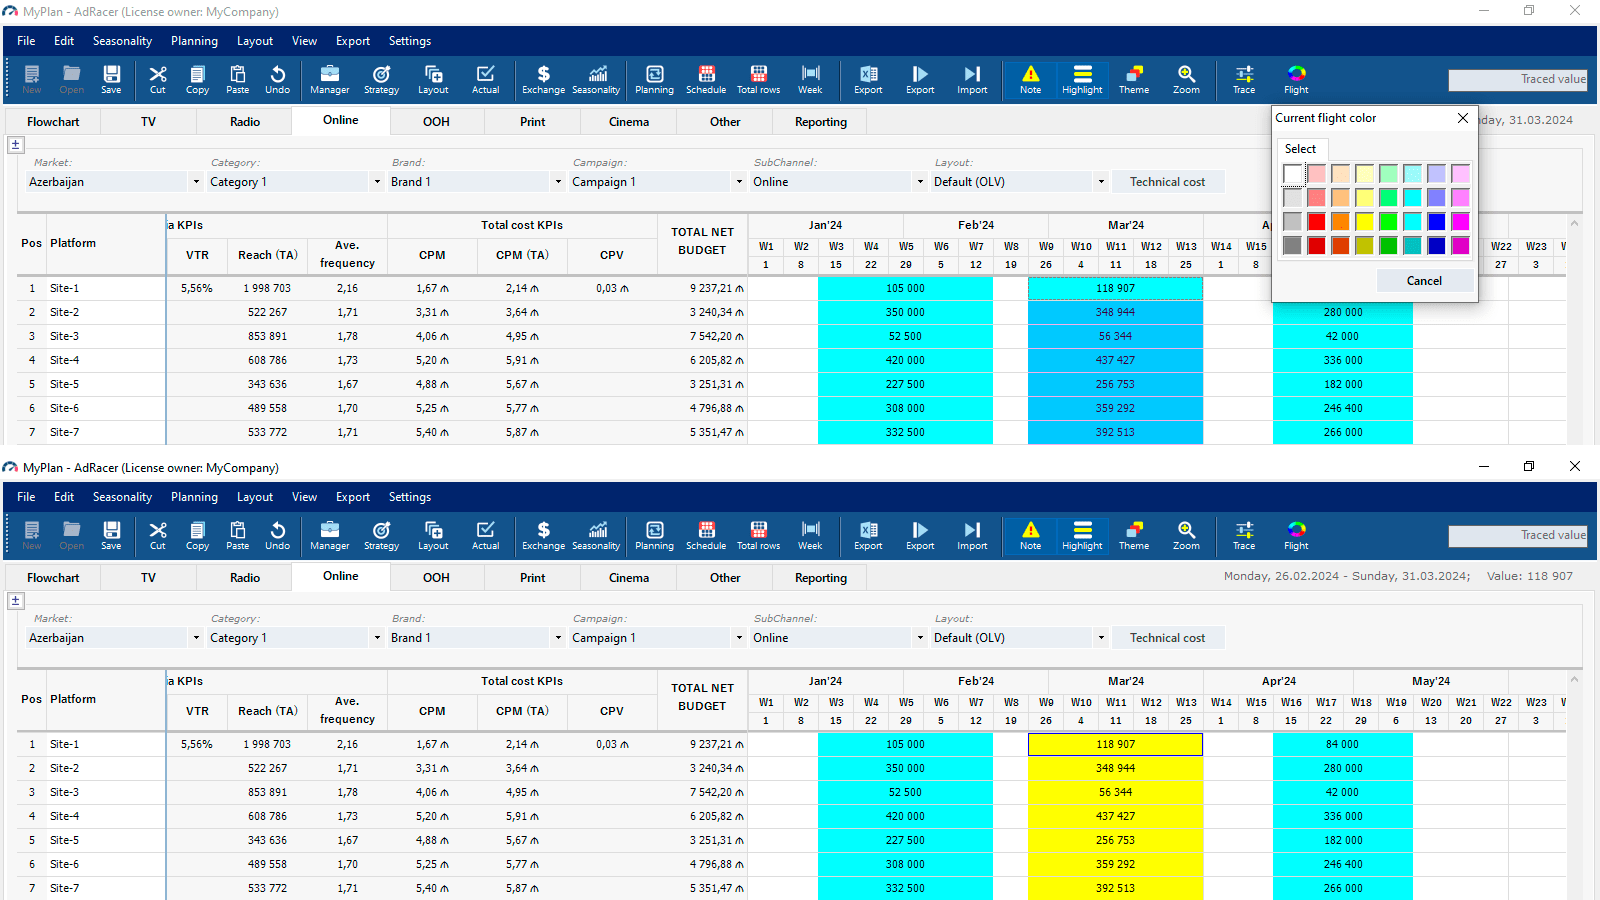
For visual distinction, the active period in the activity schedule is highlighted in color (default - Cyan). However, the user can use different colors to highlight and distinguish activities. To do this, select the activity period you want to highlight and choose a color using the Color-picker button - Flight. The selected period will be filled with the chosen color. You can highlight not only the existing activity in the activity schedule but also an empty period and set the fill for this period. Then, when activity appears in this period, it will be filled with the set color.
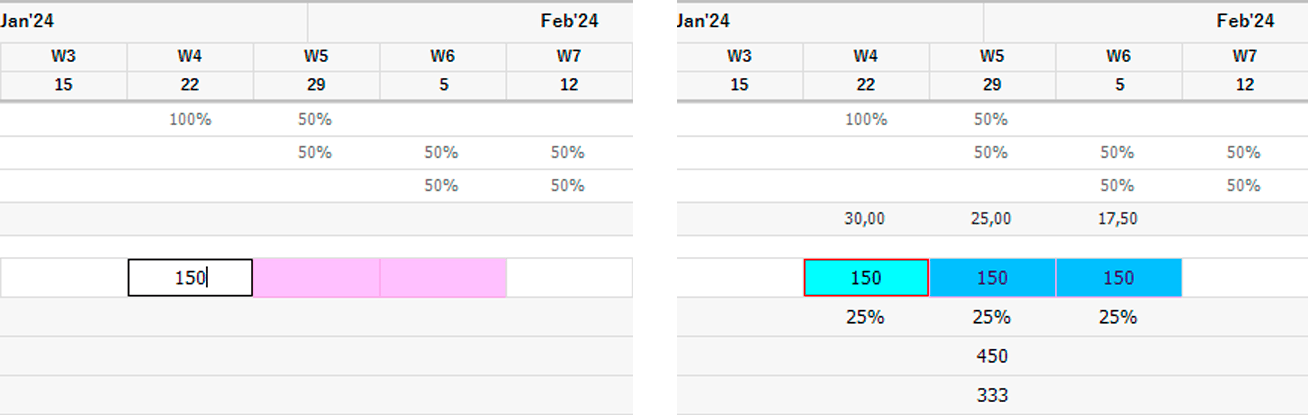
Auto-fill is used to simplify working with the program and save time: select the required period, enter the value, and press CTRL + ENTER.
You can also use the auto-fill function if you already have a value set in one of the cells: select the period starting from this cell and press CTRL + ENTER. The auto-fill function can be used both in the Weekly TRP row and in the Copy share block:
Week Breakdown. By default, the schedule in the TV plan is divided into calendar weeks. If the planned activity starts not from the first day of the week or ends not on the last day of the week, and you want to accurately reflect the activity period, you can break down the corresponding weeks.
Right-click in the cell of the desired week to open the context menu and click on the item Break down the week. Use the slider to split the week into two parts and click Apply:
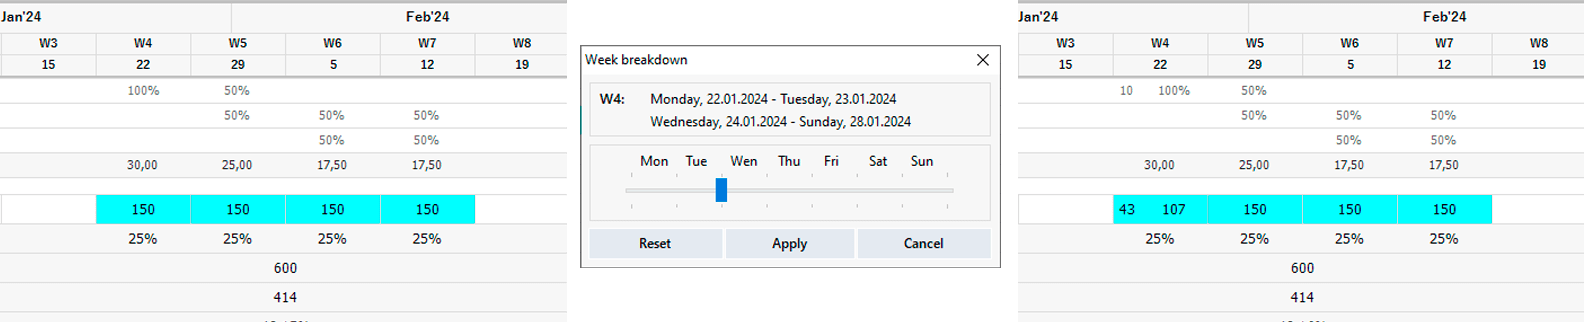
⚠ Breaking down weeks is not exported to Excel – in the Excel file, only splitting overlapping weeks by months is possible.
Changing the Width of Cells. In some cases, such as with split weeks or high Weekly TRP values, the data may not fully display in a standard-width cell. You can increase the width of the cells by clicking the Week button on the toolbar. Clicking it again will return the cells to their standard width.
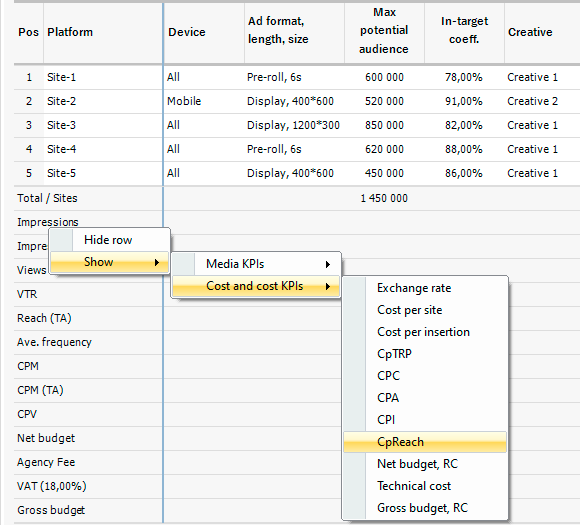
Displaying Additional Metrics and KPIs
If you need to temporarily add any metrics not included in the current media plan format, open the context menu by right-clicking on the header of any row, select Show, and then choose the required parameter from the corresponding group:
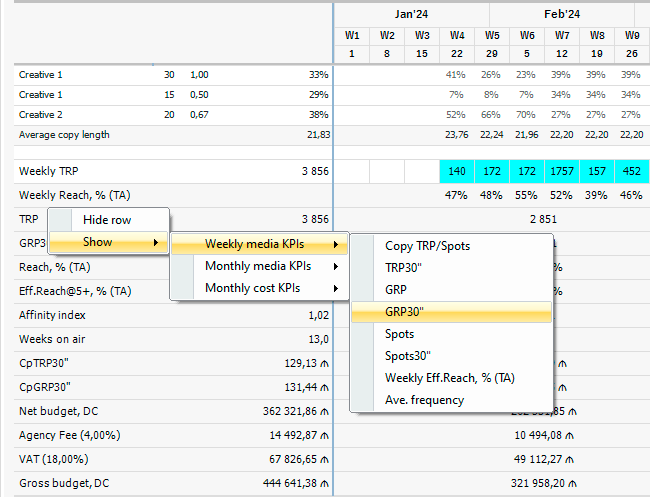
For easier navigation, the metrics are divided into three groups:
- Weekly media KPIs
- Monthly media KPIs
- Monthly cost KPIs
To hide unnecessary metrics, open the context menu on the corresponding row and select Hide row.
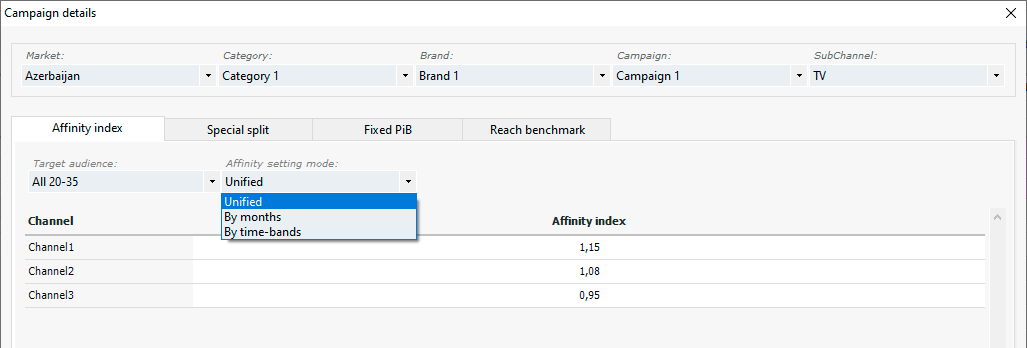
Click the Campaign details button on the TV tab and select the desired campaign in the Campaign details window.
The Campaign details window includes 4 tabs.
On the Affinity index tab, set the affinity indices for the channels. There are 3 models for setting affinity indices:
- Unified: a single index is set for each channel.
- By months: indices are set for each month.
- By time-bands: indices are set for each position in the deal configuration (separately for prime and off-prime time, for fixed and floating placements).
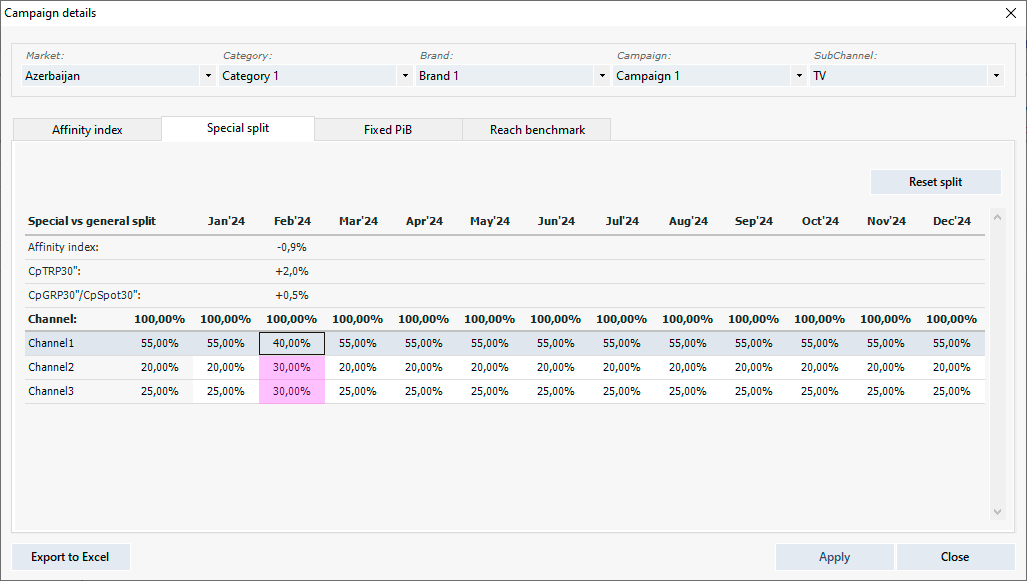
The Special split tab allows you to set a special (different from the general deal) channel split for certain periods. The deviation of the key split KPIs relative to the general deal is displayed:
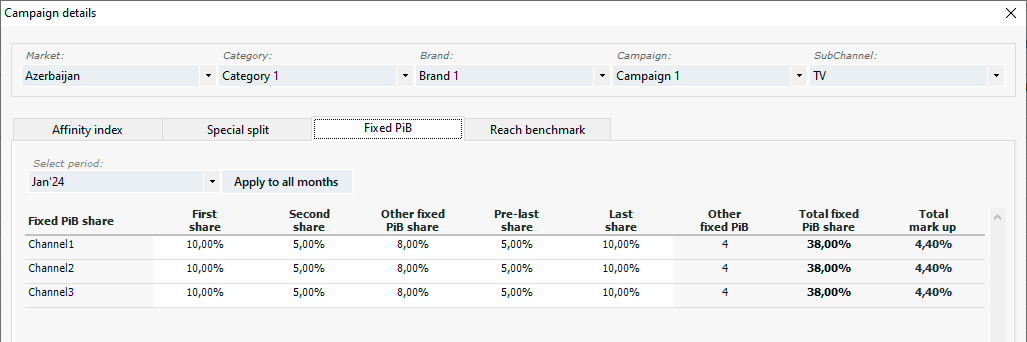
On the Fixed PiB tab, you can set the planned share of placements on fixed positions in ad breaks for a specific month (shares are set by GRP or minutes, according to the deal’s Buying model).
Different shares can be set for different months.
Besides the first, second, penultimate, and last positions, you can also fix any other position in the ad break: enter the position numbers in the Other fixed PiB column and the share of placements on these positions in the Other fixed PiB share.
On the Reach benchmark tab, benchmarks are set for the automatic calculation of reach in the media plan. Select a TV channel, or choose "Total" if you are creating a total benchmark for the entire channel split.
The media plan only reflects the Total reach and frequency (across the entire channel split), so you may limit yourself to creating total benchmarks. However, if you want to see reach and frequency by channels in the reports, you need to create benchmarks for each channel individually.
When you first load the benchmarks, you can set the effective frequency on which the weekly and monthly effective reach will be based (for example, 3+ and 5+). If you do not set the effective frequency, the program will read it automatically from the imported Excel file.
⚠ The weekly and monthly effective frequency may be the same, in which case the data will be duplicated. Nevertheless, they must be filled out for both weekly and monthly reach.
Data for benchmarks is imported directly from an Excel file. Click the Import from Excel button, select the Excel file with the data in the standard Windows file opening window, and click Open. The program will check the imported data for correctness, load it into the table, and generate a chart for visual assessment of the results. If the imported data is incorrect (e.g., incorrect format, etc.), the program will display an error message.
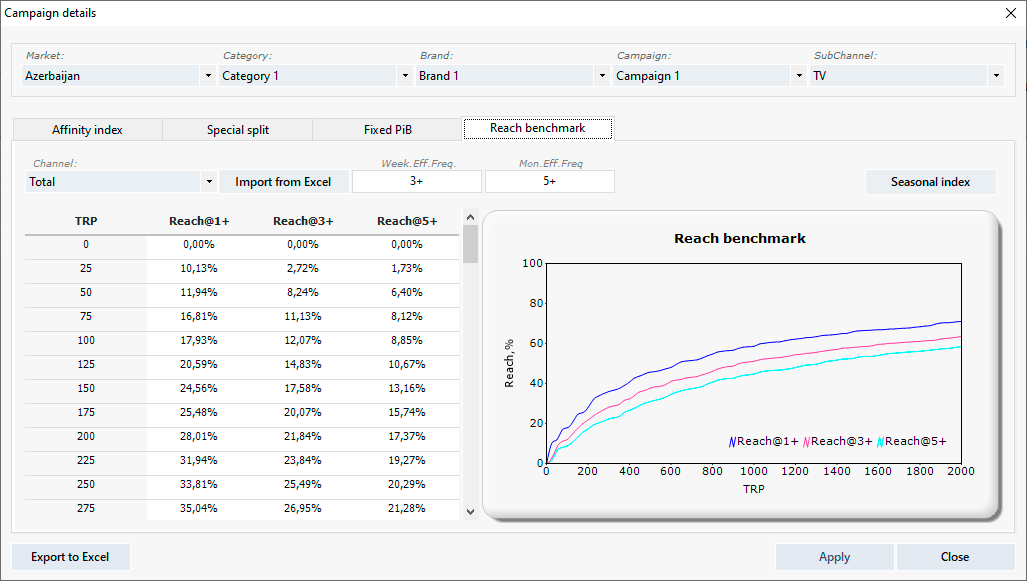
Download the Reach benchmarks template with detailed guidance
The source data in the Excel file may not have a standardized step (in the example, it's 25). You can use benchmarks from a regular spot-by-spot export. However, to optimize disk space usage and improve performance, the application will standardize the data.
Clicking the Seasonal index button will open a window for setting seasonal coefficients for reach. These coefficients are set by month and applied to all benchmarks of the current campaign.
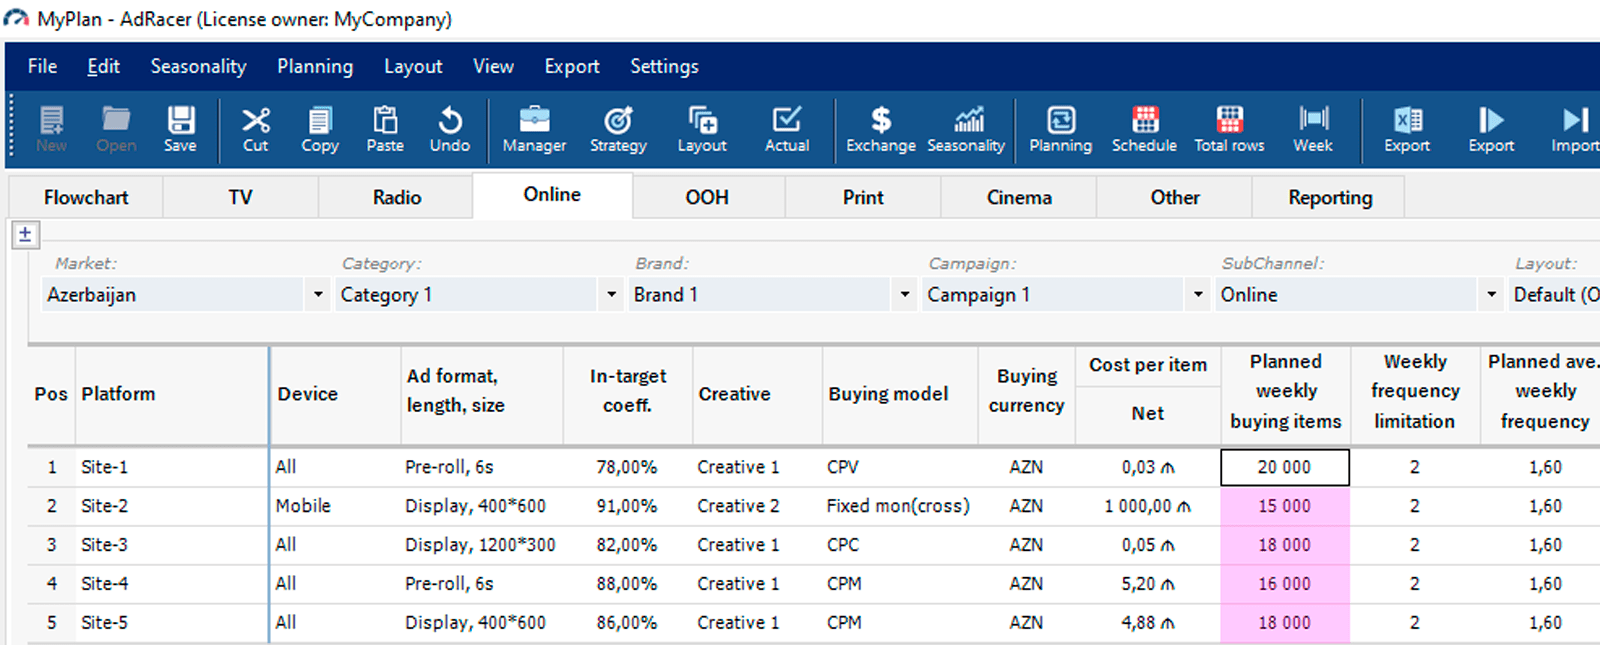
Planning campaigns for all non-TV communication channels (Online, OOH, Print, Cinema, Other) using the application is largely similar. This section uses an online campaign as an example to illustrate the principles and functionality of the application, which are common to all non-TV channels. The specific features of each channel are discussed in subsequent sections.
Terms Used in the Documentation:
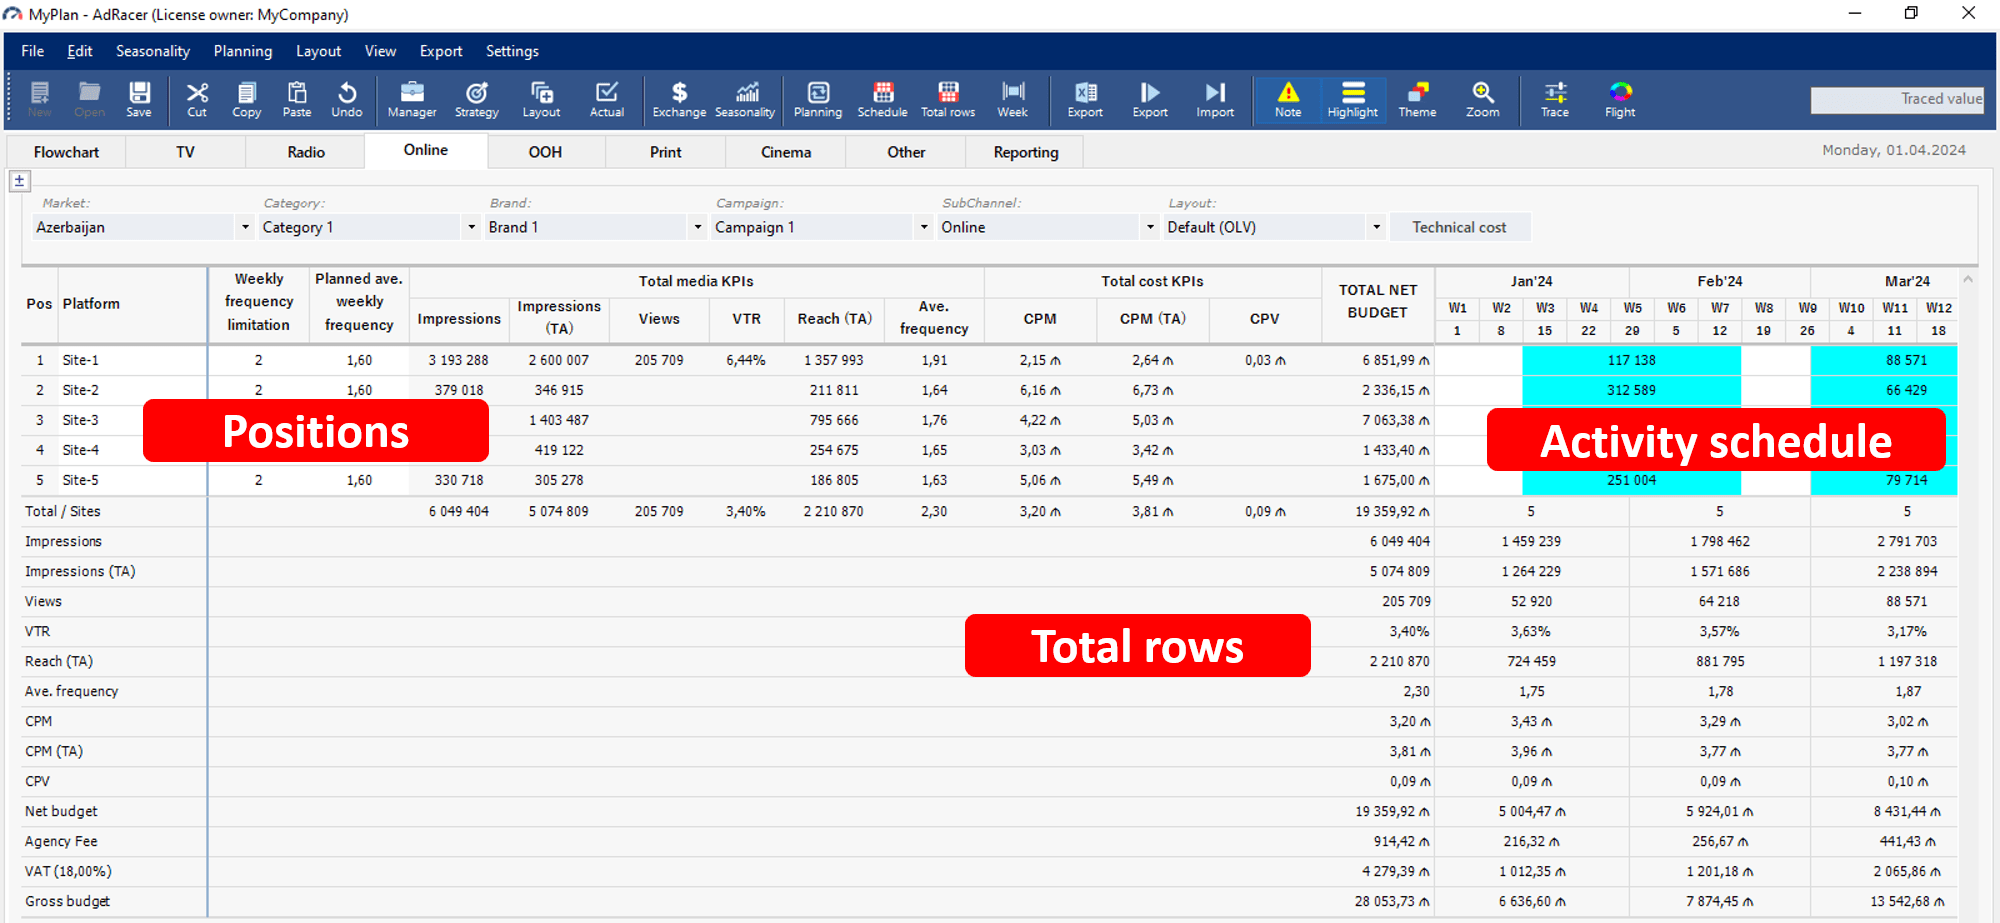
Position: A row in the media plan representing a single platform (e.g., an internet site (Platform), an OOH location (Location), a print edition (Edition), a movie in Cinema (Movie). In Other, a position is represented as an Item).
Activity Schedule: A calendar (schedule) in the media plan indicating the period (month, week, day of the month).
Total Rows: Rows showing the total (summary) KPIs for all positions.
Go to the appropriate module (Online, OOH , etc.) and select the desired campaign and subchannel.
By default, in each group of media channels, the program automatically selects the first active subchannel of the first campaign in the Manager’s portfolio from the dropdown lists.
⚠ Communication channel modules (tabs) are only activated if these channels are used in the current project. For example, if none of the project’s campaigns includes Online channels, you won’t be able to access the corresponding module.
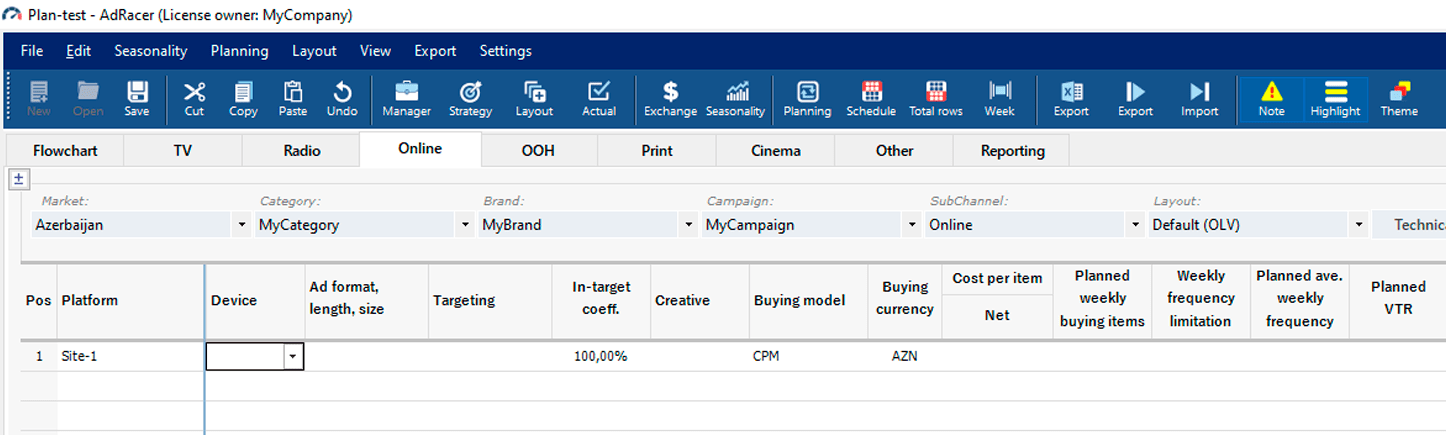
1. Enter the position name (for Online it’s Platform, for OOH - Location, for Print - Edition, for Cinema - Movie, for Other - Item) in the first row of the table and press Enter to activate the row (hereafter referred to as "positions").
The autocomplete function will suggest default values for some parameters, such as Territory (not included in the default layout), Ad type (not included in the default layout), In-target coeff., Buying model, Buying currency, and some others specific to each channel, which you can manually change if necessary:
⚠ The program does not allow empty rows between position rows, so initially only the position name cell of the first available row is editable to add a new position.
2. Fill in other necessary position parameters.
Parameters like Buying model, Buying currency, Cost per item, are mandatory - without them, the program cannot calculate the media plan. For this reason, Delete and Cut operations are not available in the Buying model and Buying currency cells.
Some parameters are not mandatory but are needed to calculate specific metrics, e.g., In-target coeff. (the coefficient representing the share of the target audience in the buying audience) is necessary for calculating Impressions (TA) - target contacts, Planned average frequency for calculating reach, Planned VTR, CTR, CR, ER in the Online plan - for calculating derivative metrics, Max potential audience - for automatic control of calculated reach, etc.
Some parameters are informational and do not affect the plan’s calculation (e.g., Ad format, Ad position, Device, Targeting , etc.).
You can view the complete list of available parameters and metrics in the (Layout designer).
Cells with dropdown lists usually offer a selection from a limited set of values (except for some columns where you can choose a value from the dropdown list or enter an arbitrary one). In cells without dropdown lists, you can enter any values.
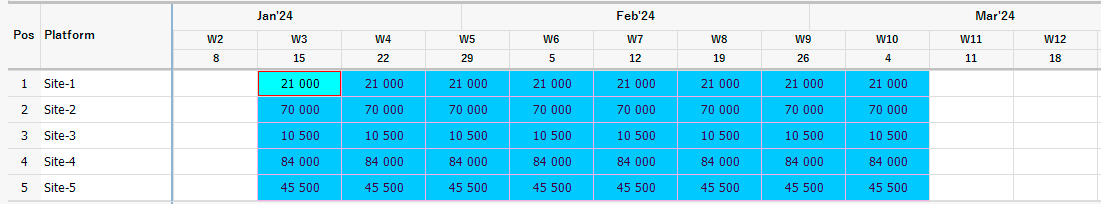
1. Data in the Activity Schedule (Schedule) can have one of three possible representations:
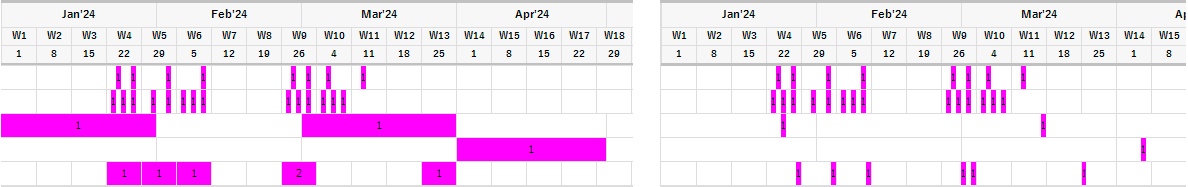
Daily (or Flight): periods of continuous activity are grouped by days:
Weekly: the schedule is divided into calendar weeks:
Monthly: periods of continuous activity are grouped by days, with a separation by months:
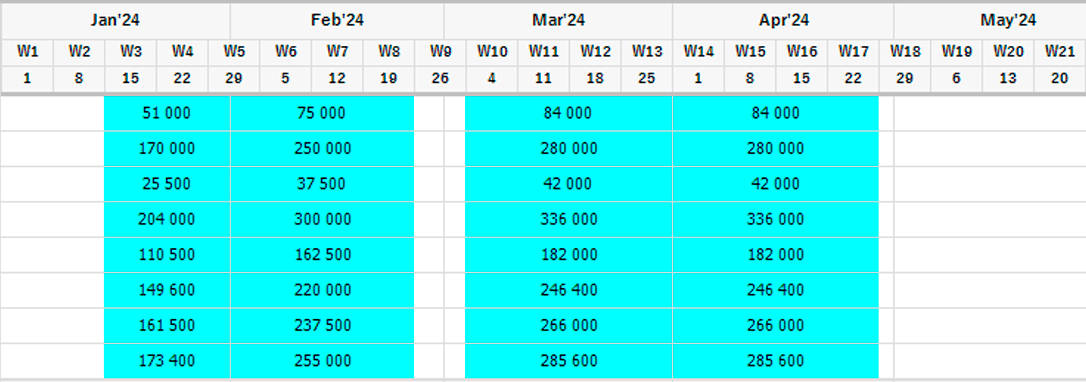
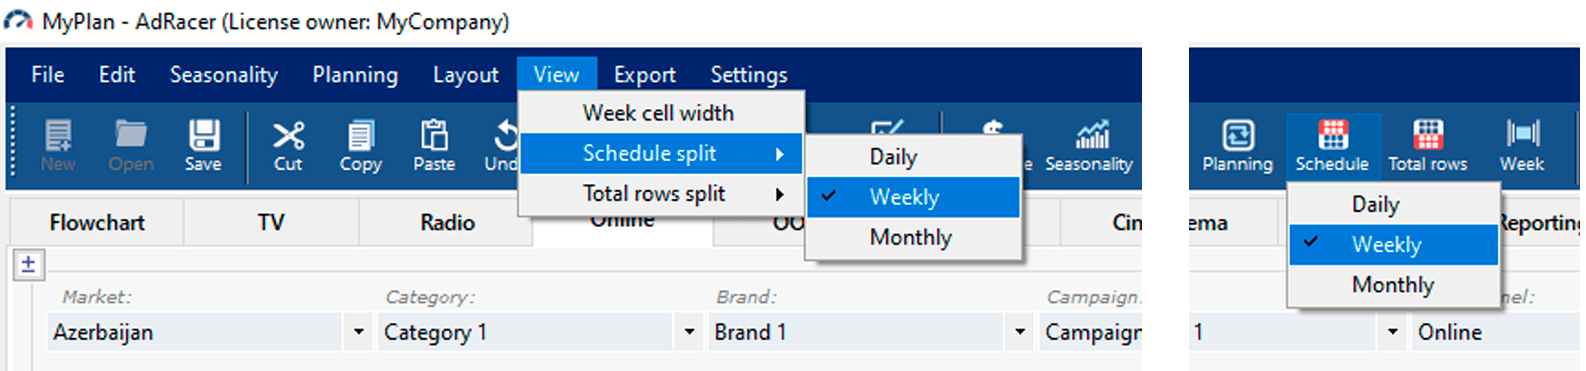
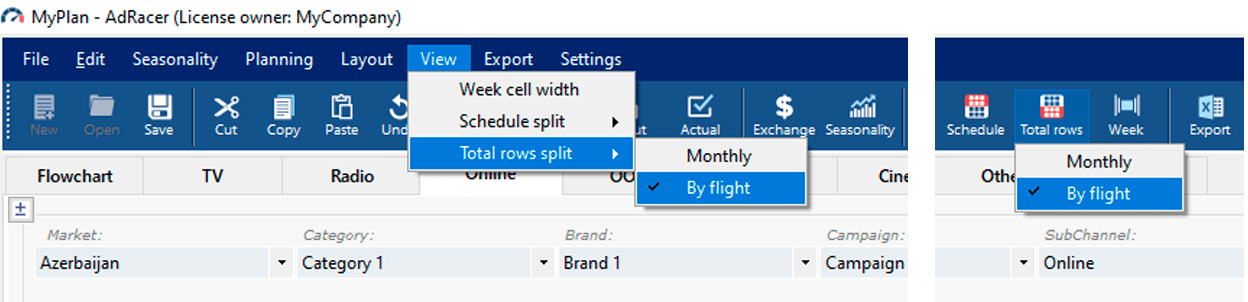
You can select a representation using the Schedule button on the toolbar or the View menu:
⚠ An exception is Print, where the activity schedule can only have By periodicity or Daily representations. In the former case, periods in the activity schedule are grouped according to the edition’s periodicity, e.g., for monthly editions - month, for weekly - week.
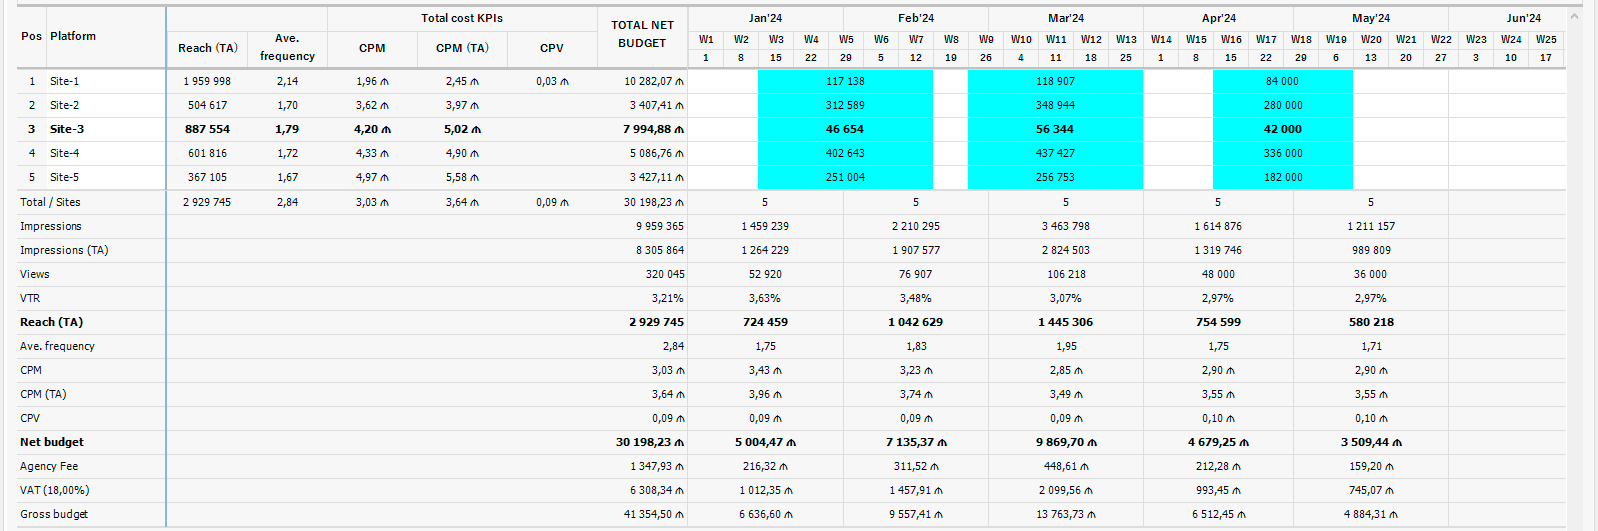
2. Values in the activity schedule usually reflect buying units (with some exceptions). More details about displaying KPIs in the activity schedule of each channel are available in the following sections.
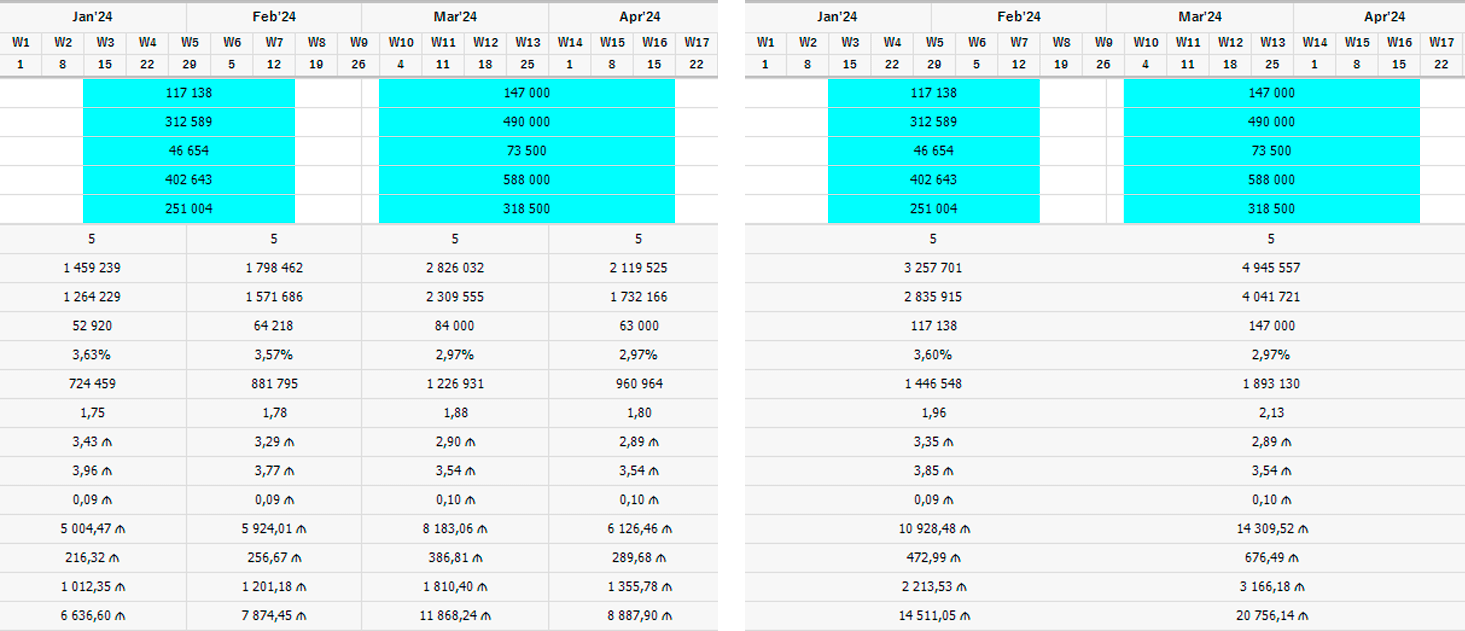
3. Total rows of the activity schedule (totals for all positions) can have two representations: by months (KPIs are divided by calendar months) and by flights (KPIs are divided by flights):
⚠ In the application, a flight is considered continuous or conditionally continuous activity with intervals (gaps) not exceeding one full calendar week.
You can choose the total row representation using the Total rows button on the toolbar or the View menu:
Manual Data Entry
In the Weekly activity schedule, enter a value and press Enter:
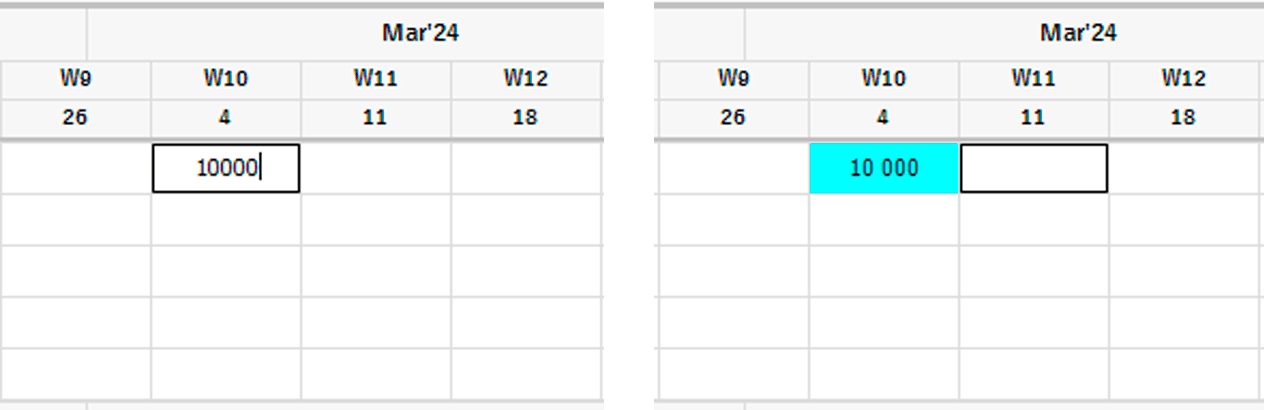
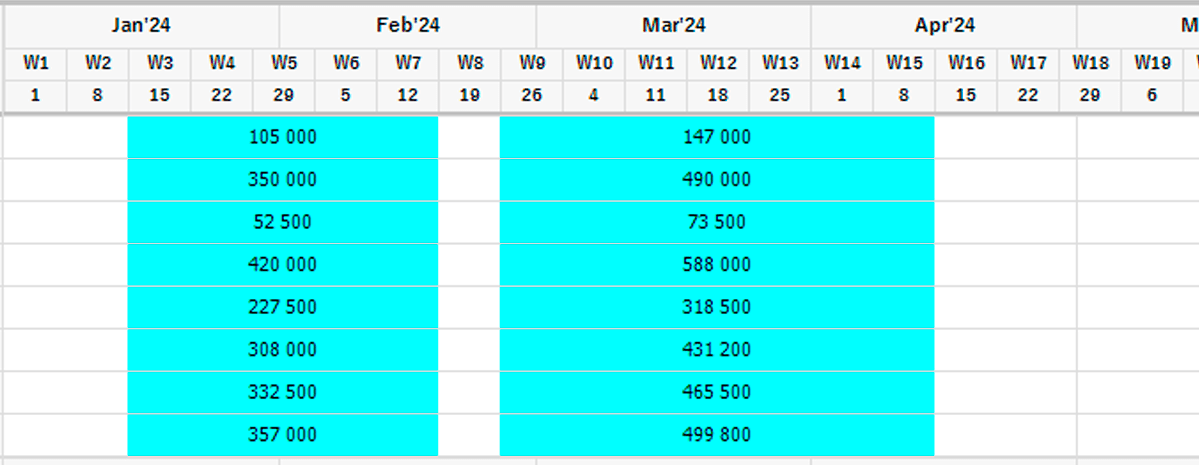
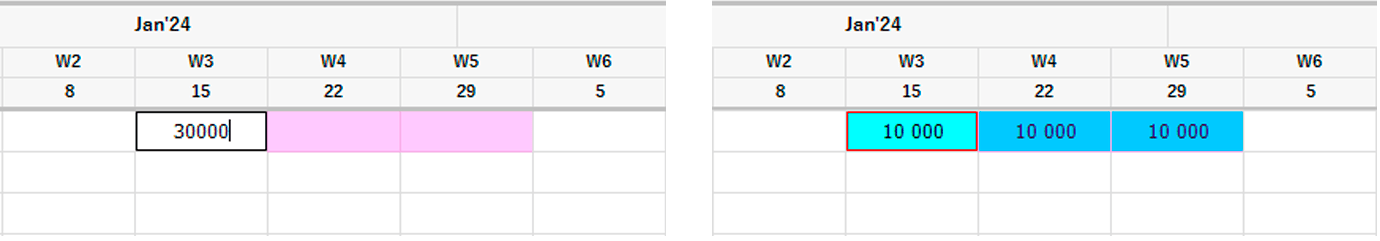
You can fill in several weeks simultaneously, but in this case, the entered value will be distributed over the selected period: select the range of cells, enter the value, and press Ctrl + Enter:
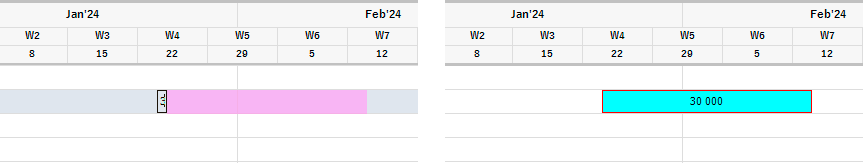
Similarly, the activity schedule is filled in Daily or Monthly representation: select the necessary period, enter the value, and press Ctrl + Enter. The value will be evenly distributed over the selected range, and the period itself will be merged:
Using Planning Patterns
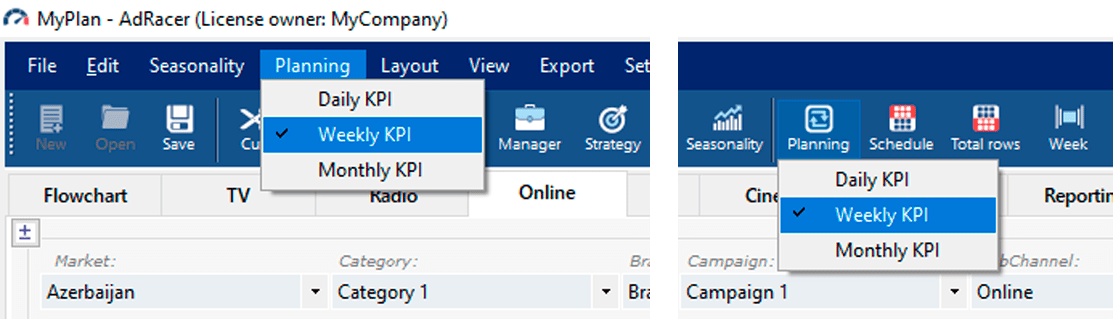
To simplify and speed up the planning process, the program provides the usage of planning patterns (or templates). Set the required planned amount of KPIs (impressions, views, spots, etc.) for a certain period in the Planned weekly buying items column:
By default, the Weekly pattern is set, i.e., the number of KPIs per week is set in the specified column. Still, you can change the period to Daily or Monthly using the Planning button on the toolbar or the Planning menu. In this case, the Planned buying items column will display the number of KPIs per day or month, respectively:
After setting up the patterns, simply select the required period in the activity schedule and press Ctrl + Enter without entering any values: the selected period will be filled according to the assigned amount of buying KPIs:
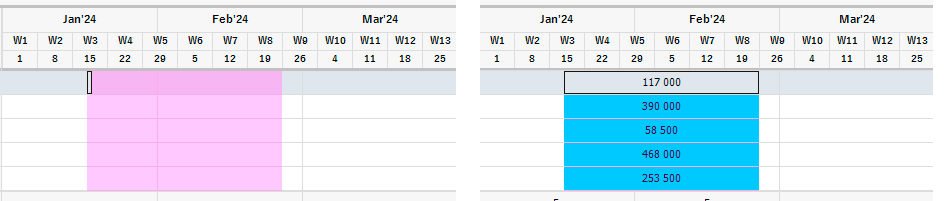
Regardless of the selected period’s length, the filling is implemented using the specified amount of KPIs per day/week/month.
Next, you can change the number of KPIs in the template and fill in a new period with new values.
If necessary, any auto-filled value in the activity schedule can be changed manually.
⚠ The values assigned/reassigned in the planning pattern do not apply to the existing activity schedule: to reschedule the existing activity, you need to refill the required period as described above (select and press Ctrl + Enter).
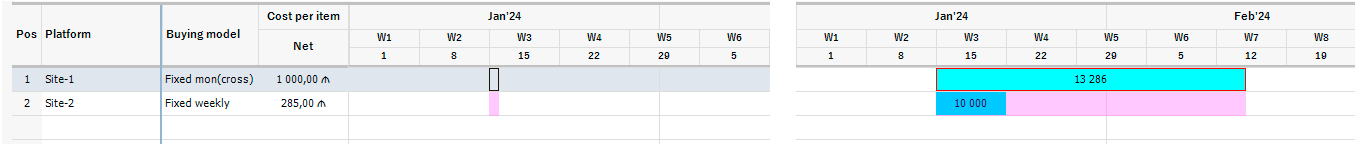
Auto-filling the Activity Schedule for Fixed Cost Positions
To fill the activity schedule for positions with a fixed placement cost when a planning pattern is set, simply select the start day of the desired activity period and press Ctrl + Enter: the auto-fill function will fill the period according to the buying model (for Fixed monthly - month, for Fixed weekly - week) and the set amount of KPIs in the template:
Color Highlighting of Flights
For visual distinction, the active period of a position in the activity schedule is highlighted in color (default - Cyan). However, the user can use different colors to highlight and distinguish activity. To do this, select the activity period to highlight and choose a color using the Flight Color-picker button. The selected period will be filled with the chosen color:
You can highlight not only the existing activity in the activity schedule but also an empty period and set its fill color. Then, when activity appears in this period, it will be filled with the set color.
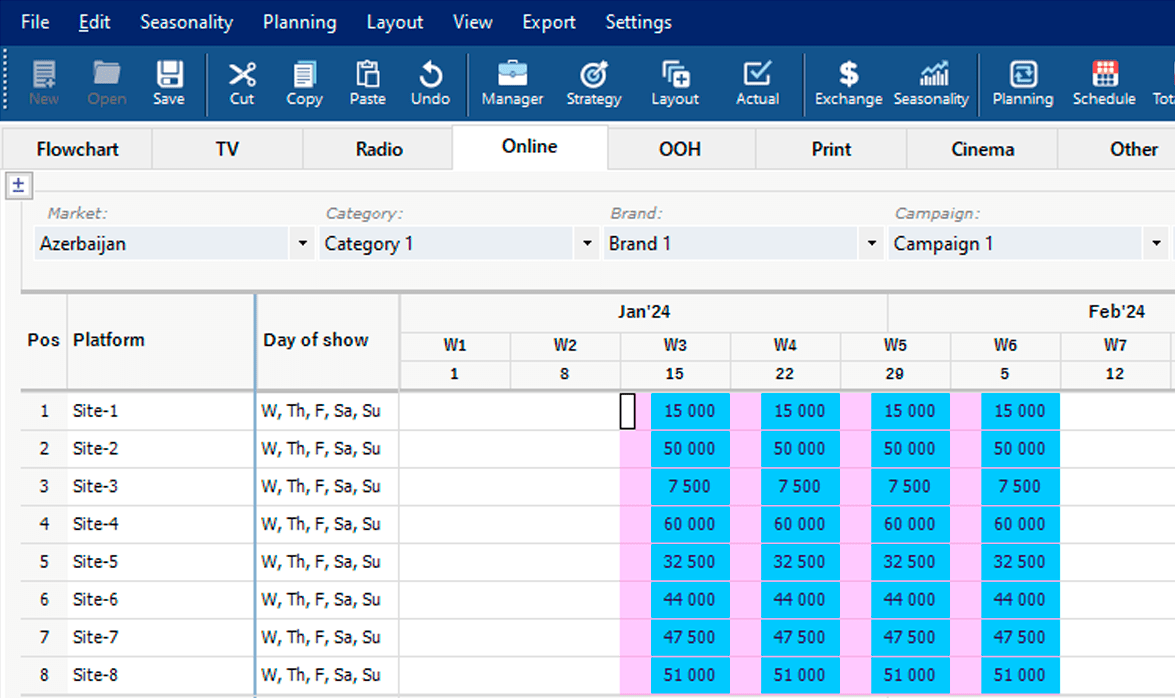
In some cases, the client may want to focus activity on specific days rather than placing it continuously throughout the week.
To plan such placements, select the desired day of the week in the Day of show cell dropdown list, or multiple days in the Day of show window by double-clicking the Day of show cell of the required row:
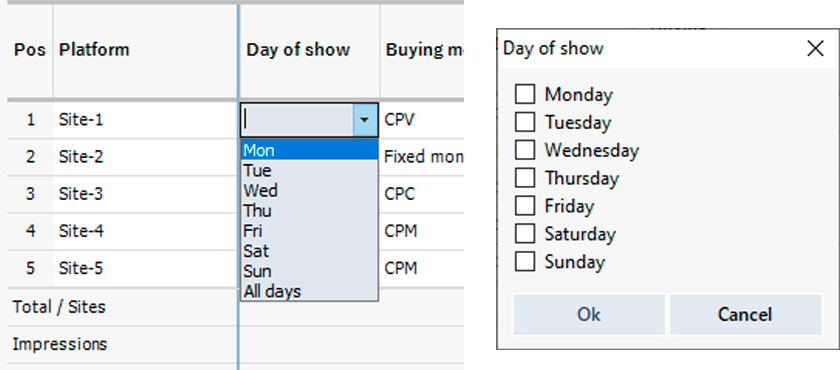
Example of auto-filling the activity schedule with the set Day of show:
If necessary, any value in the activity schedule can be changed manually.
When selecting the All days option in the dropdown list, just like when the Day of show is not set, the activity is evenly distributed over all days of the week.
With the set Day of show, data entry on unauthorized days is not possible.
⚠ The assigned Day of show does not apply to the existing activity schedule: to reschedule the existing activity, you need to refill the required period (select and press Ctrl + Enter).
Displaying Parameters and Metrics Not Included in the Layout
Positions data: invoke the Show context menu by right-clicking the header of any column and select the required parameter from the corresponding group. The selected column will be displayed in the plan:
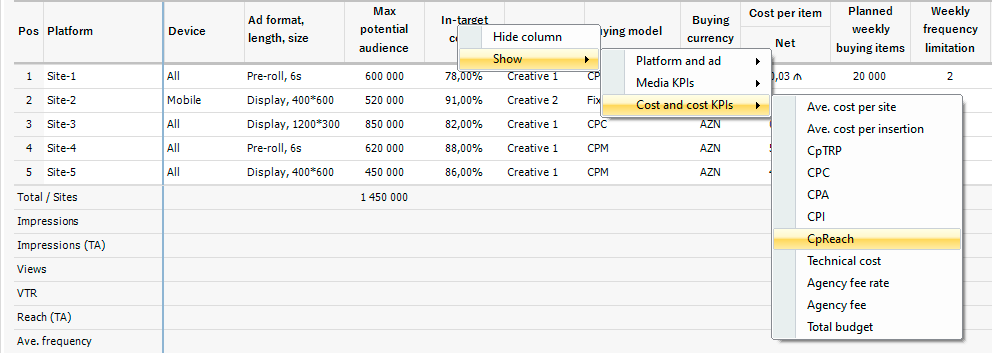
Total rows: invoke the Show context menu by right-clicking the header of any total row and select the required parameter from the corresponding group. The selected row will be displayed in the plan :
To hide an unnecessary column or row, call its context menu and select Hide column (Hide row).
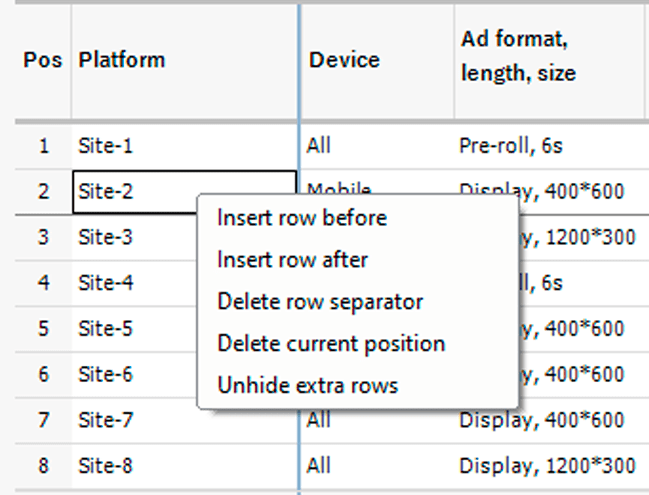
Context Menu of Position Rows
It is invoked by right-clicking on the position name (site, location, etc.) and contains the following commands:
Insert row before - inserts a new row before the currently selected position
Insert row after - inserts a new row after the currently selected position
Delete current position - deletes the current position
Insert row separator / Delete row separator – visually separates/removes the separation of positions (in the example below, positions 2 and 3 are separated)
Hide extra rows / Unhide extra rows – (or double-click the Position (Platform, Location, etc.) column header) - hides/shows extra position rows: by default, the media plan initially includes 10 empty rows for adding positions. As they are filled, additional rows are automatically added:
Row Highlighting
With many positions or many metrics displayed in total rows, the plan's readability may deteriorate. To view and analyze data for a specific row, you can temporarily highlight it by double-clicking the left mouse button on the header of that row (on the Pos. - Position column).
You can highlight multiple rows simultaneously.
To remove the highlight, double-click the header of the highlighted row again:
Automatic Control of Calculated Reach
Set the Max potential audience parameter of a position for automatic control of the calculated reach (it is possible to assign Max potential audience both for individual positions and for the entire plan).
If the user sets too high impressions values (or other KPIs for Online - views, clicks, etc., for which impressions is a derivative calculated metric), resulting in an unacceptably high calculated reach (e.g., higher than the set maximum potential audience of the site), the program will issue a warning:
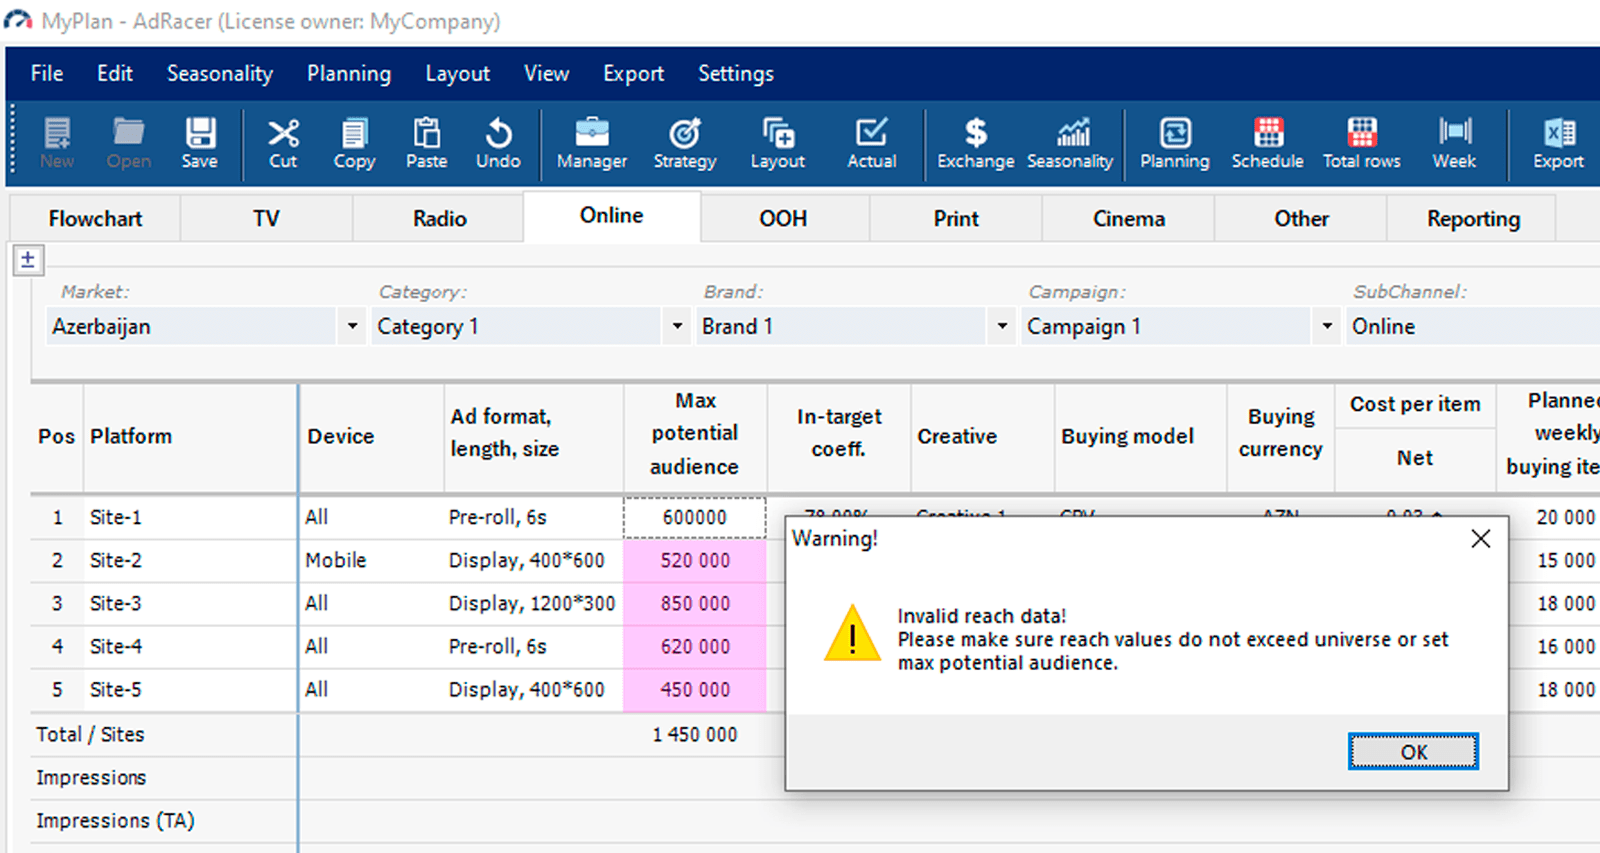
By default, a warning is issued if the calculated reach exceeds the target audience size.
In such cases, the plan needs to be reviewed - reduce the number of impressions or increase the frequency of contacts.
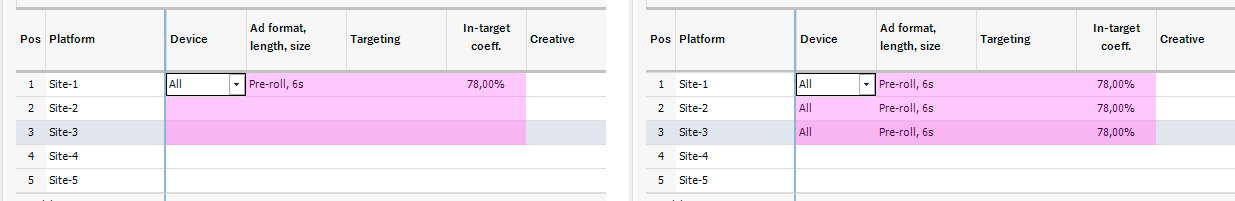
Auto-filling Position Parameters
The auto-fill function is available not only in the activity schedule but also for filling identical values of position parameters. Enter data for one position, then select the required range of rows and press Ctrl + Enter:
Windows Clipboard Operations
The program supports standard Windows clipboard operations - Copy, Cut, Paste, both within the program itself and external - from/to Excel.
You can invoke the corresponding operation using the buttons on the control panel, menu items, or by pressing the standard key combination: Ctrl + X (Cut), Ctrl + C (Copy), Ctrl + V (Paste):
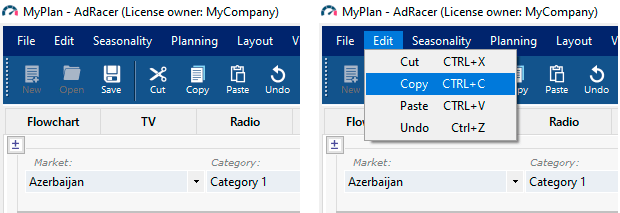
You can undo the last performed action by pressing the Undo button, selecting the corresponding menu item, or pressing Ctrl + Z.
⚠ You can only undo actions performed in tables - any change, input, fill, delete, cut, paste data, etc. Some operations, such as inserting or deleting position rows in plans, cannot be undone. Actions performed in child windows can only be undone until they are closed and before pressing the Apply button - after returning to the main window or pressing Apply in the child window, these actions cannot be undone.
This section discusses the features, principles, and functionality of the application specific to Online media channels. Please first review the section on Planning Non-TV Campaigns, which covers the general approaches and functionality applicable to all non-TV media channels.
The following buying models are available for online media plans in the application:
CPM: Cost per thousand impressions
CPV: Cost per video view
CPC: Cost per click
CPA: Cost per action
CpInsertion: Cost per insertion (e.g., for Influencer marketing, reflecting the cost per post, story, reel, etc.)
Fixed monthly/weekly/daily: Fixed cost for continuous ad placement on a site for a specific period (month, week, day).
Fixed mon(cross): A variation of the fixed monthly placement cost. The difference from the Fixed monthly buying model lies in the cost calculation method.
If the placement occurs from the first to the last day of the month, the total cost for both Fixed monthly and Fixed mon(cross) models will be identical.
The cost calculation difference arises when the campaign does not start on the first day of the month and covers two or more calendar months.
For the Fixed monthlymodel, if the campaign spans from one calendar month to another, the placement cost is calculated separately for each calendar month (based on the number of active days in that month), and then the costs for all months are summed up.
For the Fixed mon(cross) model, the monthly price applies to a period of one month from the start of the placement: for example, if the placement begins on May 10, one month of placement is considered from May 10 to June 9, the second from June 10 to July 9, and so on.
The activity schedule generally displays the number of buying units (except for buying models with fixed costs). Below is a list of KPIs reflected in the activity schedule for various buying models:
Technical cost refers to the cost of ad serving, verification services, etc., provided by third-party companies. To assign technical costs and include them in the plan, click the Technical cost button within the Online tab.
In the Technical cost setting window, you can assign both KPI-based costs (e.g., cost based on the number of KPIs tracked by the system - impressions, views, etc.) and fixed costs for individual positions or the entire campaign:
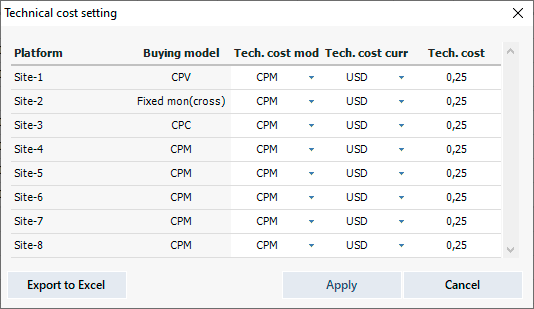
When assigning a fixed cost, it is distributed across periods within a position, or in the case of Fixed total – across periods and positions, according to the distribution of impressions.
This section discusses the features, principles, and functionality of the application specific to OOH (Out-of-Home) media channels. Please first review the section on Planning Non-TV Campaigns, which covers the general approaches and functionality applicable to all non-TV media channels.
The following buying models are available for OOH media plans in the application:
CPM: Cost per thousand impressions
CpSpot: Cost per video spot (e.g. for Digital OOH)
Fixed monthly/weekly/daily: Fixed cost for ad placement at a specific location for a certain period (month, week, day).
Fixed mon(cross): A variation of the fixed monthly placement cost. The difference from the Fixed monthly buying model lies in the cost calculation method.
If the placement occurs from the first to the last day of the month, the total cost for both Fixed monthly and Fixed mon(cross) models will be identical.
The cost calculation difference arises when the campaign does not start on the first day of the month and covers two or more calendar months.
For the Fixed monthly model, if the campaign spans from one calendar month to another, the placement cost is calculated separately for each calendar month (based on the number of active days in that month), and then the costs for all months are summed up.
For the Fixed mon(cross) model, the monthly price applies to a period of one month from the start of the placement: for example, if the placement begins on May 10, one month of placement is considered from May 10 to June 9, the second from June 10 to July 9, and so on.
The activity schedule generally displays the number of buying units (except for buying models with fixed costs). Below is a list of KPIs reflected in the activity schedule for various buying models:
Typically, each position (location) in the media plan represents one surface. Therefore, in the activity schedule for Fixed models, "1" is generally displayed. However, this is not a strict rule; users can specify, for example, two or more surfaces for one location (in the Sites column or directly in the activity schedule).
If the media plan also includes the production of posters for OOH media, the production cost is indicated in the Production cost per site column. You can specify only the final cost (Net), or both the rate card price and discount (Rate card, Discount). In the latter case, the net cost will be calculated automatically.
You also need to specify the number of posters produced for each position. To do this, right-click on the table header row and select Show -> Location and ad - > Production schedule (q-ty), or include Production schedule (q-ty) in the media plan layout.
Enter the required number of posters for the months in which production is planned:
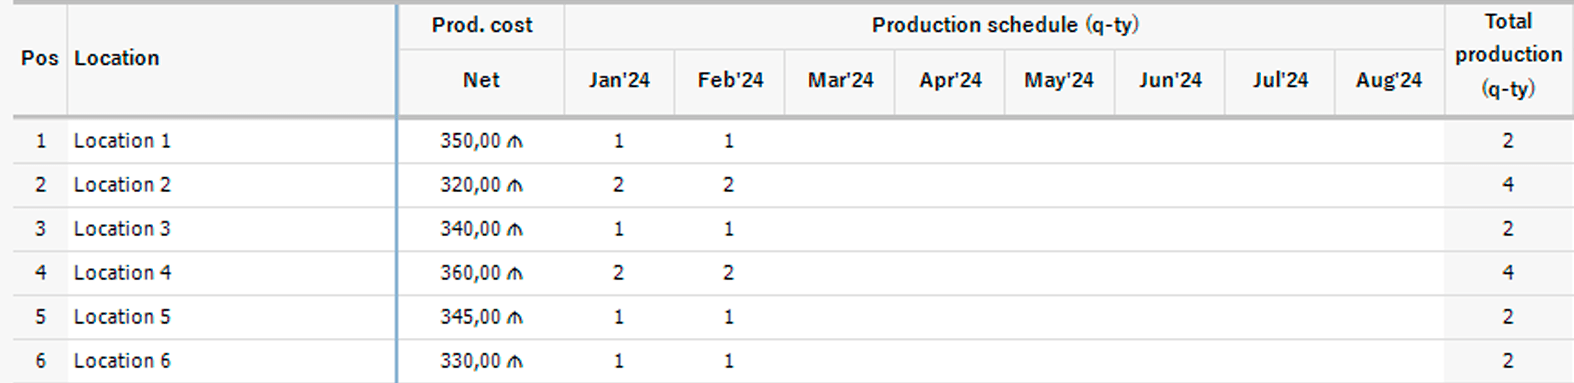
By default, posters production is assigned to the first available week of the corresponding month (in summary reports, any metrics, including budgets, can be viewed both monthly and weekly).
If it is important to specify the exact week of the month for poster production costs, double-click on the header of that month and select the desired week:
This section discusses the features, principles, and functionality of the application specific to Print media channel. Please first review the section on Planning Non-TV Campaigns, which covers the general approaches and functionality applicable to all non-TV media channels.
The following buying models are available for Print media plans in the application:
CpInsertion: Cost per ad placement
CPM: Cost per thousand impressions
In both cases, the activity schedule displays the number of ad placements.
Unlike other non-TV media channels, print has only two views for the activity schedule - By periodicity and Daily. In the first case, periods in the activity schedule are grouped according to the edition periodicity, e.g., for monthly editions – calendar month, for weekly editions – calendar week. In the second case, each placement is represented by a separate day, which is the day of the edition issue and, consequently, the day the ad appears:
By default, when users enter placements in the By periodicity activity schedule, the application assigns the first day of the corresponding month for monthly edition and the first day of the corresponding week for weekly edition as the ad placement day.
If you need to accurately reflect the days and dates of such publications in the plan (e.g., a weekly edition comes out on Fridays instead of Mondays, or a monthly edition on the 25th of each month instead of the 1st), switch the Schedule to Daily view and set the placements on the required days.
Later, when switching the Schedule back to By periodicity view, the corresponding periods (month, week) will again be grouped according to the publication frequency, but when switching the Schedule to Daily view, you will be able to see the actual placement days you set.
This section discusses the features, principles, and functionality of the application specific to Cinema media channel. Please first review the section on Planning Non-TV Campaigns, which covers the general approaches and functionality applicable to all non-TV media channels.
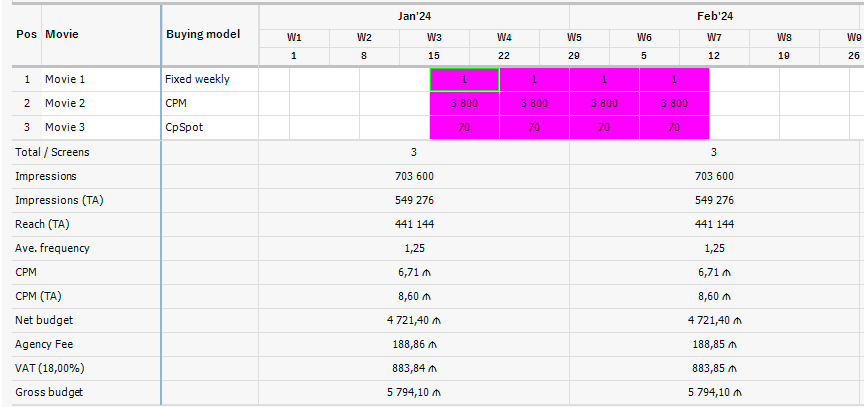
The following buying models are available for Cinema media plans in the application:
CPM: Cost per thousand impressions
CpSpot: Cost per video spot
Fixed monthly/weekly/daily: Fixed price for placing ads in all screenings of a film for a specific period (month, week, day).
Fixed mon(cross): A variation of the fixed monthly price model. The difference lies in the cost calculation method.
If the placement runs from the first to the last day of the month, the final cost for the Fixed monthly and Fixed mon(cross) models will be identical. Cost differences may arise when a campaign starts on a day other than the first of the month and spans two or more calendar months. With the Fixed monthly model, if a campaign transitions from one calendar month to another, the placement cost is calculated separately for each calendar month (based on the number of active days in that month), and then the costs for all months are summed up. With the Fixed mon(cross) model, the monthly price applies to a period of 1 month from the start of the placement: for example, if the placement starts on May 10, one month is considered from May 10 to June 9, the second from June 10 to July 9, and so on.
The most common buying model is a fixed weekly price.
The activity schedule displays the number of buying units. Below is a list of KPIs reflected in the activity schedule for various buying models:
Since each position in the media plan represents one film, the activity schedule for Fixed… buying models typically shows "1".
Cinema advertising has its own peculiarities. With fixed payment for a specific placement period (most often week), many advertisers naturally try to choose the most viewable and box-office films to reach the maximum possible audience. As a result, the start of a cinema advertising campaign is often tied to some promising premieres.
However, given the dynamics of cinema attendance throughout the week, film distributors almost never schedule a film premiere for Monday, as attendance is usually minimal at the beginning of the week. Generally, the premiere day is closer to the end of the week to ensure maximum attendance in the first days of the premiere, most often on Thursday.
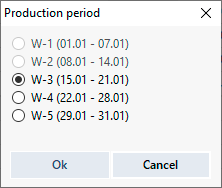
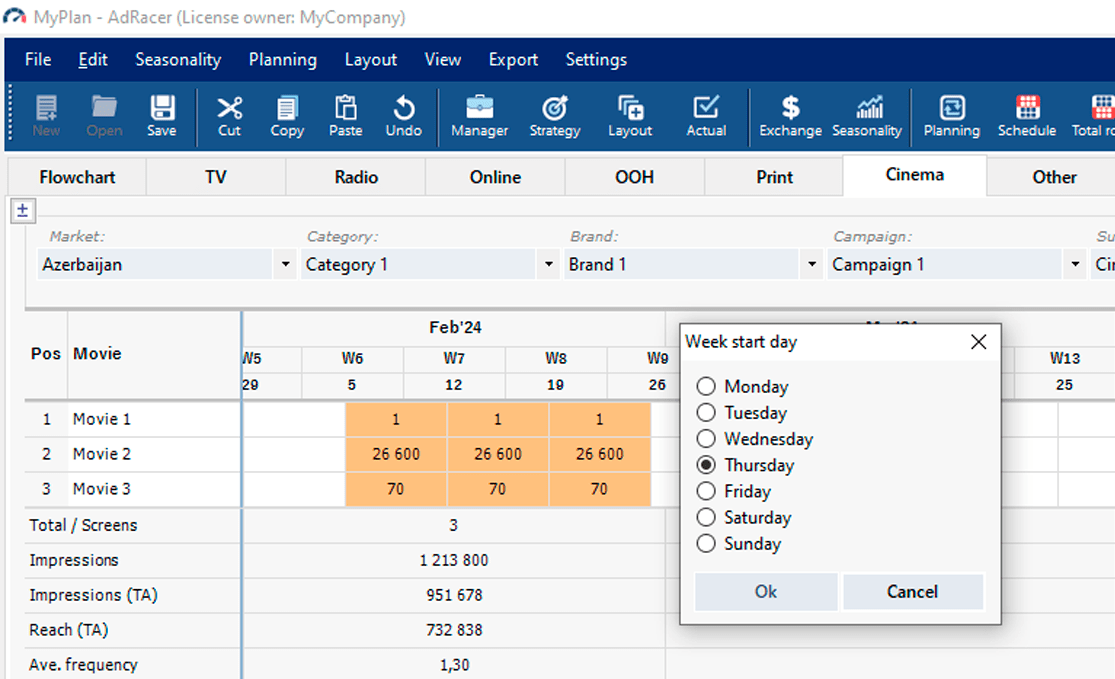
Considering this feature, the weekly breakdown in the Cinema module of the application is shifted relative to calendar weeks. By default, the start day of the week in the application is set to Thursday, but it can be changed to any other day of the week: click the Week start day button and select the desired day in the dialog box – the weekly grouping of periods in the activity schedule in Weekly view will start from the set day:
This section discusses the features, principles, and functionality of the application specific to this media channel. Please first review the section on Planning Non-TV Campaigns, which covers the general approaches and functionality applicable to all non-TV media channels.
The following buying models are available for Other media plans in the application:
CPM: Cost per thousand impressions
CPA: Cost per action
CpItem: Cost per unit (e.g., for the production of one BTL stand, the production of one video commercial, etc.)
Fixed monthly/weekly/daily: Fixed price for placing ads during all screenings of one film for a specific period (month, week, day).
Fixed mon(cross): A variation of the fixed monthly price model. The difference lies in the cost calculation method.
If the placement runs from the first to the last day of the month, the final cost for the Fixed monthly and Fixed mon(cross) models will be identical. Cost differences may arise when a campaign starts on a day other than the first of the month and spans two or more calendar months. With the Fixed monthly model, if a campaign transitions from one calendar month to another, the placement cost is calculated separately for each calendar month (based on the number of active days in that month), and then the costs for all months are summed up. With the Fixed mon(cross) model, the monthly price applies to a period of 1 month from the start of the placement: for example, if the placement starts on May 10, one month is considered from May 10 to June 9, the second from June 10 to July 9, and so on.
The activity schedule displays the number of buying units. Below is a list of KPIs reflected in the activity schedule for various buying models:
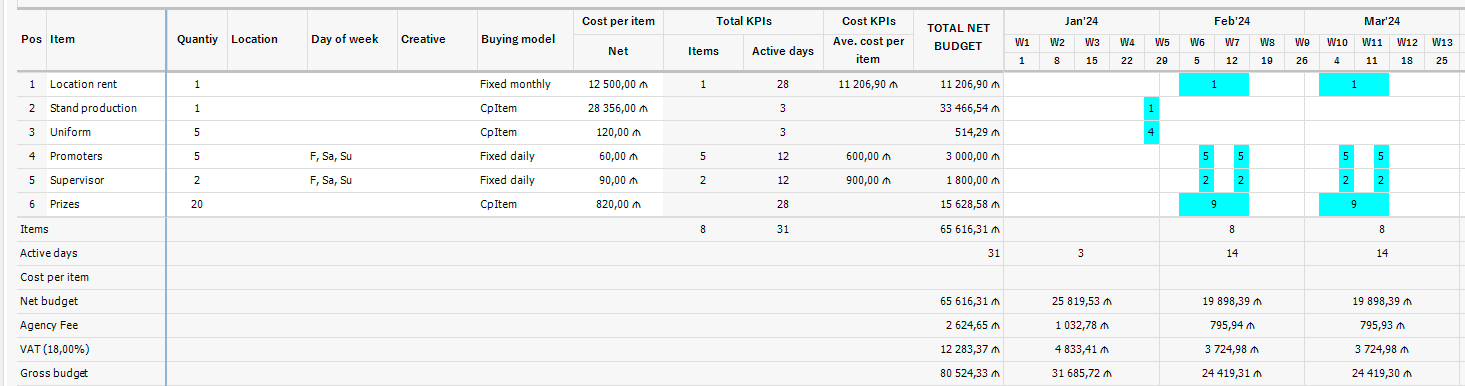
Below is an example of a BTL (Below the Line) plan, indicating the recommended buying models for the main expense items:
The Reporting module allows you to build reports, view, and analyze data for specific campaigns or communication channels, as well as any combination of them and in any context.
Select the market, category, brand, campaign, communication channel and subchannel: you can choose either a specific item or all items in any of these branches (All). Then, you can configure the report as needed:
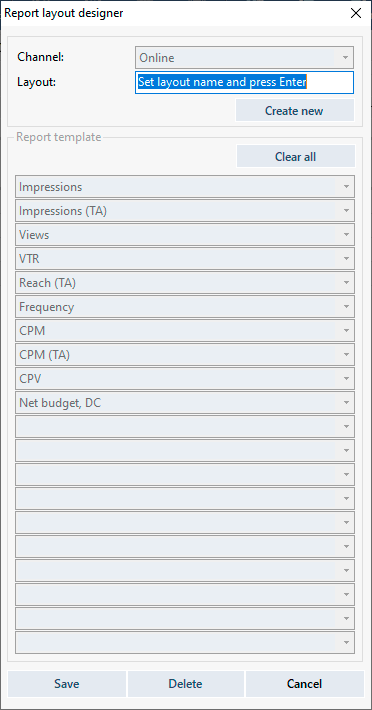
In the Reporting module, click the Layout button on the application's toolbar (if you click the Layout button from another module, the dialog for creating custom layouts for media plans, not reports, will open).
In the Report layout designer dialog box, you can view preset layouts or create your own Multi KPI report layout:
Default (preset) layouts cannot be edited.
The Actual module allows you to enter and save actual data for the past campaign period in the plan. The original (planned) data is also saved, enabling comparisons between actual and planned data using the Post-buying status when generating reports.
Actual Data Input
Actual data can be entered into the application manually, copied and pasted from an Excel file, or directly imported from an Excel file.
While importing from an Excel file, the source file should be prepared strictly in a specified format:
Download the templates with detailed guidance
Splitting Actual Data
The application allows for the entry/import of actual data with the following breakdowns:
⚠ Actual data entry for print media only supports the Daily split, i.e., data is entered for each ad placement (issue).
Actualizing Data

⚠ Start week and End weekcan only include either actualized or non-actualized (planned) periods; you cannot select an interval that includes both actualized and non-actualized weeks.
By default, the template is built for weekly data entry, but if you select the Daily split from the dropdown list, the template will be rebuilt automatically. A template is not built for the Spot-by-spot split as this split does not support manual data entry.
Viewing and Editing Existing Actual Data
If you select an already actualized period in the Start week and End week dropdown lists, the Set button will change to Review, allowing you to view or edit the actualized data.
Note that for storage optimization, the application does not store actual data in Daily or Spot-by-spot splits but converts them into a Weekly split. Therefore, previously saved actual data will always be viewed in a weekly breakdown, regardless of the split used for data entry.
The actualized period cannot be edited in the plan. Moreover, the presence of an actualized period in the campaign imposes certain restrictions on editing even the planned part of the campaign. For example, it is impossible to change the buying model in a campaign that includes an actualized period (there are also other restrictions).
If you need to "cancel" the actualization of the campaign for any reason, you can change the status of the actualized period to Planned. To do this, select the desired period in the Setting actual data window and click Reset as planned (at the bottom of the window). After that, the actual data for the selected period will be deleted from the application, and this period will be considered as planned, while retaining the key KPIs from the actual data. Secondary, derived KPIs may change as they will be recalculated based on the planned deal, conversion rates, etc.
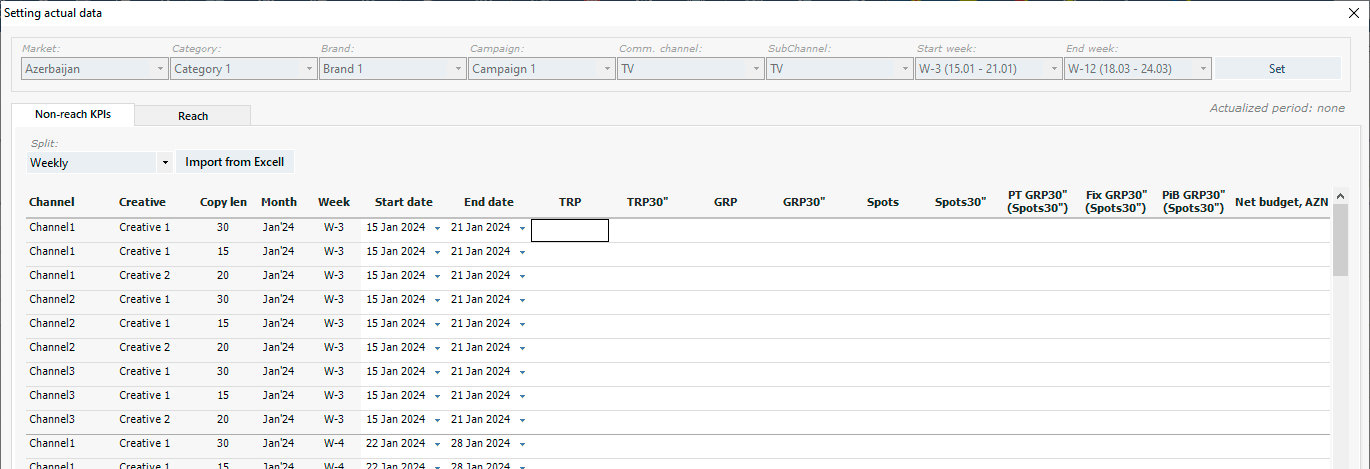
Using the above described method, select the desired campaign, communication channel and sub-channel, period, and click Set.
Entering Non-Reach KPIs (GRP, Budget, etc.)
On the Non-Reach KPIs tab, select the desired data split and enter the data manually, copy-paste from Excel, or import from a pre-prepared Excel file. In the latter case, click Import from Excel, select the source file, and click OK.
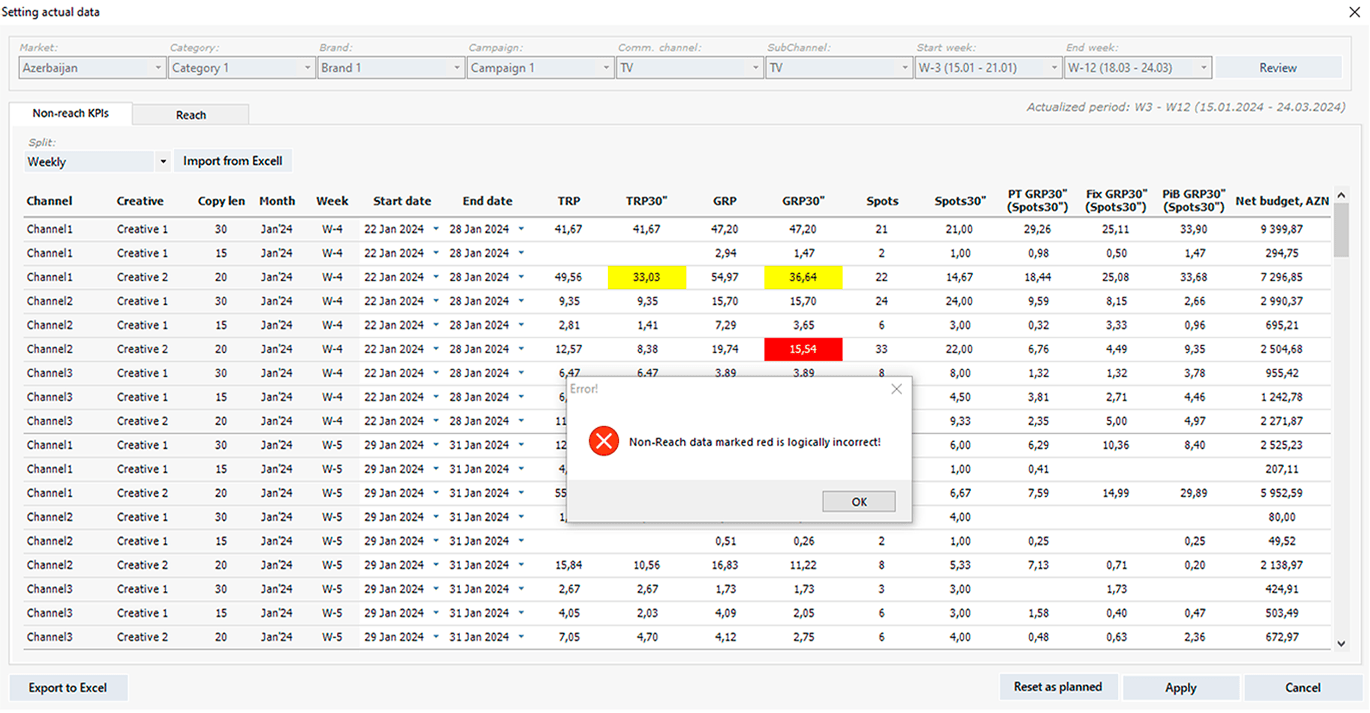
If the application cannot read any values during paste or import (e.g., due to incorrect data format in the source file), the user will receive a corresponding message.
In case of logical errors in the entered data (e.g., discrepancies between GRP and GRP30”), the application will notify of such errors.
Yellow cells indicate potentially incorrect data – a warning is displayed but does not block the application. Red cells indicate definitely incorrect data, and the application is blocked until the error is corrected .
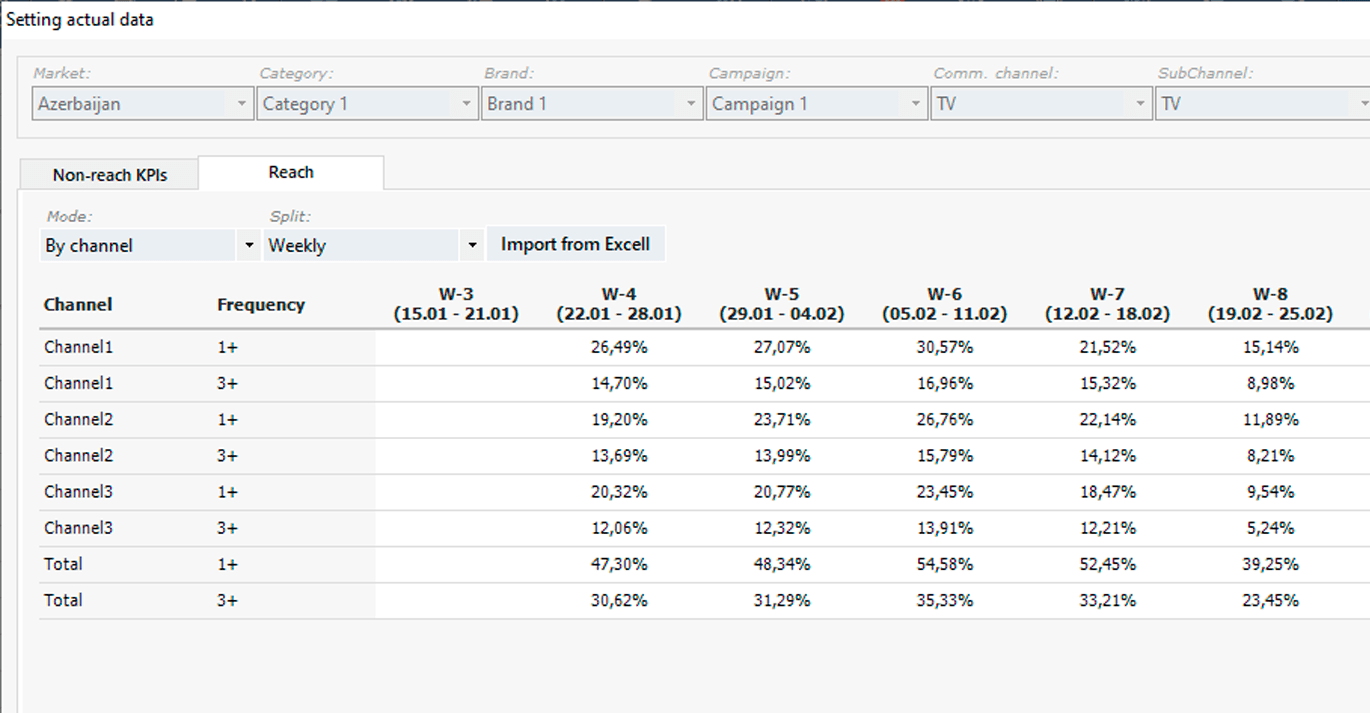
Entering Reach Data
Switch to the Reach tab. Actual reaches can also be entered manually, copied and pasted from Excel, or imported from Excel.
Actualizing reach data in the application allows for various variations and can be quite labor-intensive, so you can limit yourself to entering only the reaches that are truly necessary.
In the application, actual reaches can be entered separately by channels and by creatives:
Reach by channels
Weekly: Reaches by calendar weeks of the actualized period.
Monthly: Reaches by calendar months of the actualized period. If the actualized period covers an incomplete calendar month, the current value of the actual reach for the actualized part of the month is entered. Subsequently, when adding new actual data (subsequent weeks) to the current month, the reach of that month is updated with the new actual value.
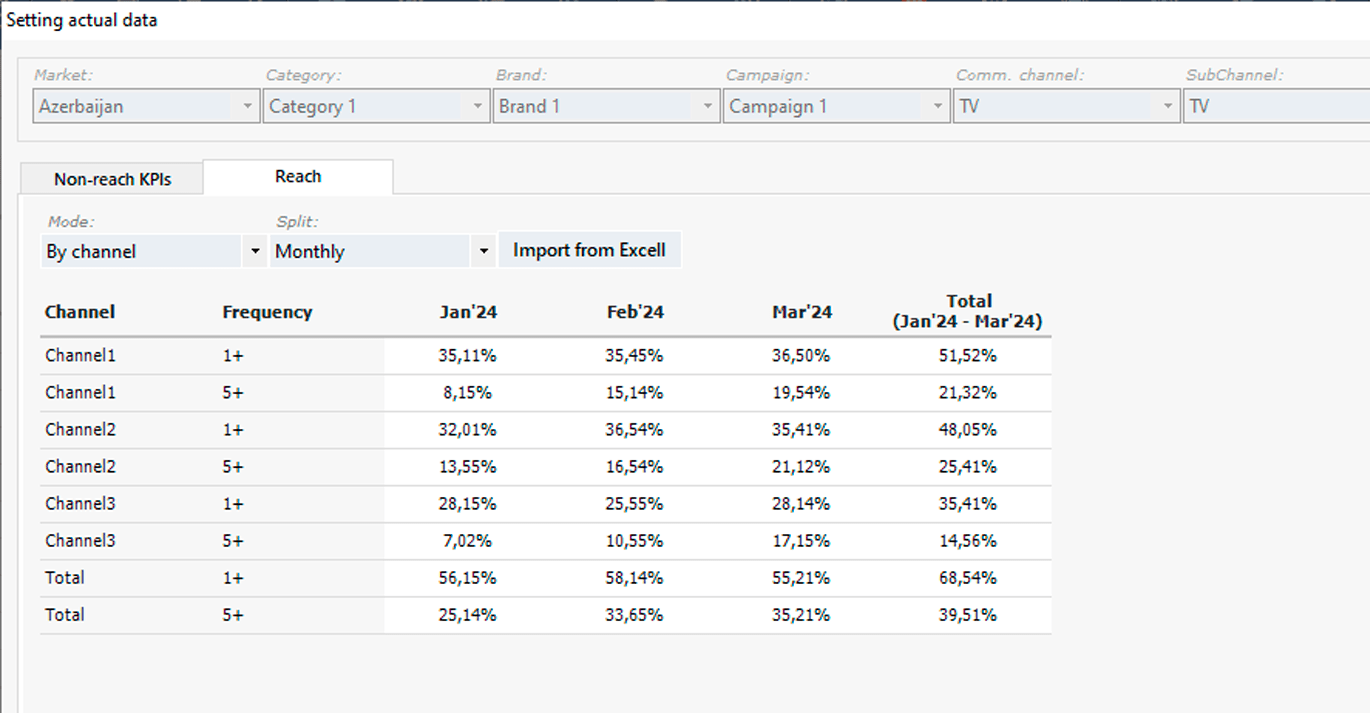
In both cases, the Total row indicates the total reach over all positions (channels).
The Total column contains the cumulative reach for the entire period from the campaign start (!) to the last actualized date. In this regard, when importing data retrieved from TV monitoring into the application, it is recommended to extract from the monitoring the data for the entire available campaign period (respectively with a weekly or monthly breakdown) - the application will identify the necessary weeks or months by itself.
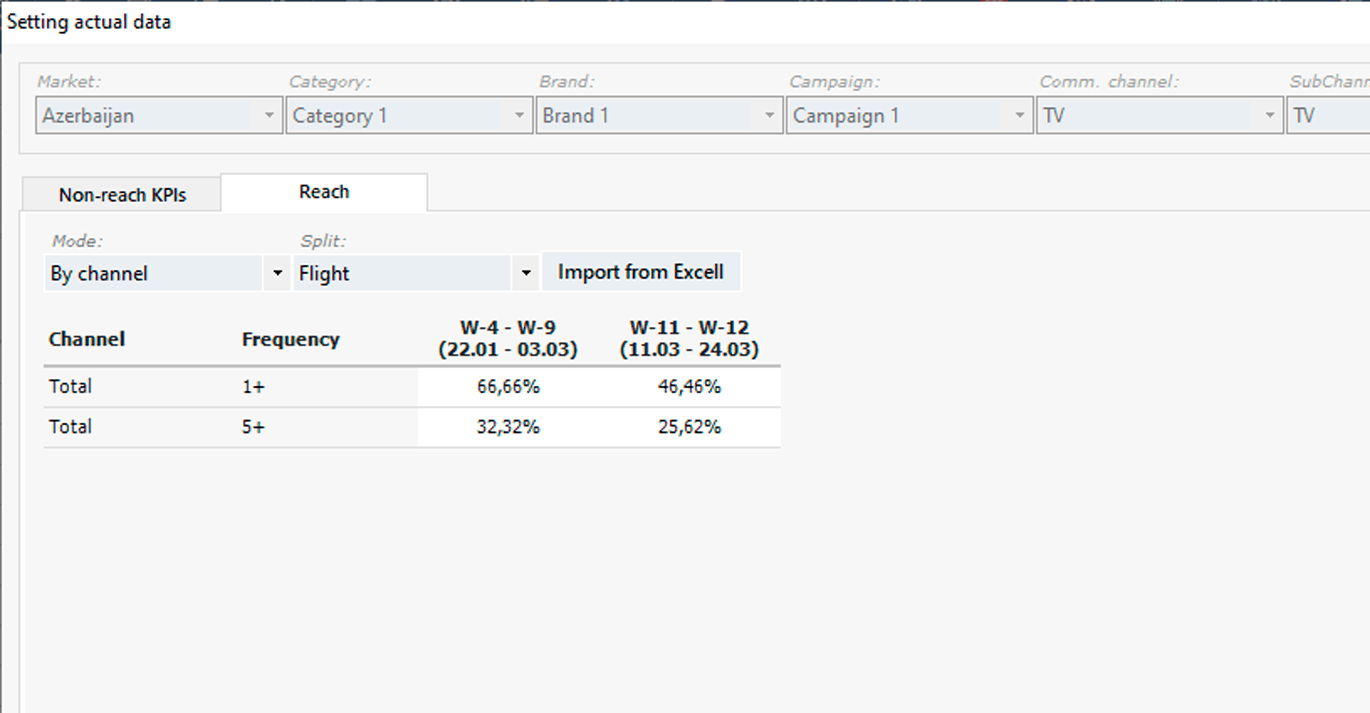
Reach per flight: the cumulative actual reach of the current flight of the campaign, from the start date of the flight to the end date of the flight (or till the last actualized date if the flight is not completed yet). The app determines flight periods automatically, based on the uploaded actual non-Reach KPIs:
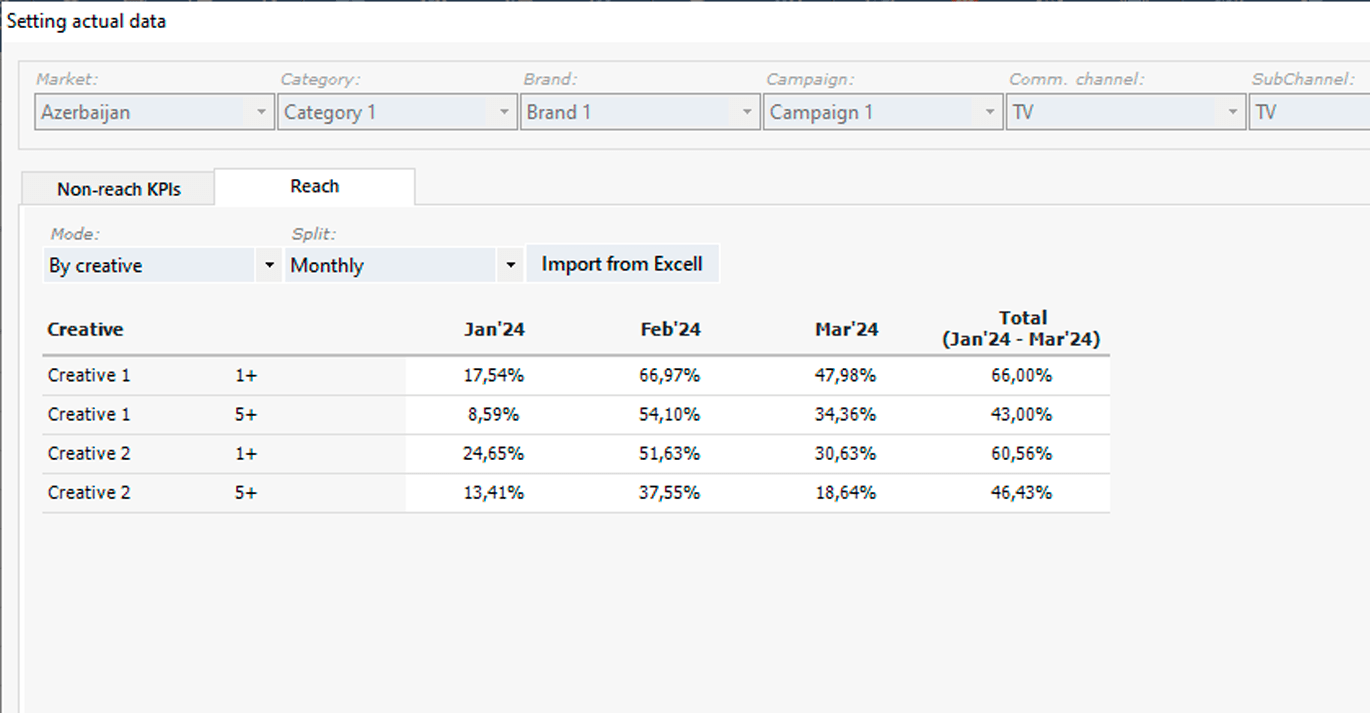
Reach by creative
Is entered in the same way, for each used creative, but without a breakdown by channels.
Also, filling of the Total row and by-flight reach is not implied.
The application implies usage of two effective frequencies - in the example 3+ and 5+. The first is used to determine weekly, the second – monthly and by-flight effective reach. Surely, the user can assign any other effective frequencies, but they should correspond to the frequencies specified in the media plan.
Such a detailed approach to entering actual reaches is due to the specific methodology for calculating reach in the application. Typically, the planned reach in the media plan is calculated based on the Reach benchmarks loaded into the application. However, when a campaign or a separate flight of the campaign is already partially actualized, the final reach of such a campaign or flight is calculated not just based on benchmarks but also considers the already accumulated actual reach (which may significantly deviate from benchmarks), allowing for more accurate forecasts of the final reach of the campaign or flight.
As mentioned above, it is not necessary to enter all actual reach data if it is not crucial. If some data is not entered, the application will notify and offer to calculate the missing data automatically. If confirmed, the application will calculate the missing actual reaches based on benchmarks, considering the actual number of target ratings accumulated, and save this data as actual.
Actual reaches for non-TV campaigns are entered similarly to TV campaigns. The key difference is that non-TV campaigns do not imply entering of effective reach data due to the complexity or sometimes the impossibility of obtaining such data.
When entering/importing actual non-Reach data (Impressions, sites, etc.), each communication channel has specific identifiers for positions – for example, for online campaigns, it is Platform, Device, Format, for OOH – Location, Type&Size, etc.
Positions identifier should totally match to the media plans. The main identifier (for online - Platform, for OOH - Location, for priny - Edition, for cinemas - Movie and for other channels - Item) should be always filled in. Other identifiers, if they are not filled in in media plans, also remain empty.
The application allows you to export any table (media plans, dialog box tables, etc.) to Excel by clicking the Export to Excel button in the corresponding module or application window. The exported tables in Excel appear exactly as they do in the application, requiring no further adjustments or settings.
In addition to exporting individual tables, the application also allows you to selectively export multiple tables (from the main modules) simultaneously into a single Excel file.
Click the Export button on the toolbar, or the Export menu in the menu bar. In the drop-down list, select Current table to export the table from the currently active module (e.g., TV, Online plan, flowchart, report, etc.), or Set options to configure the export operation.
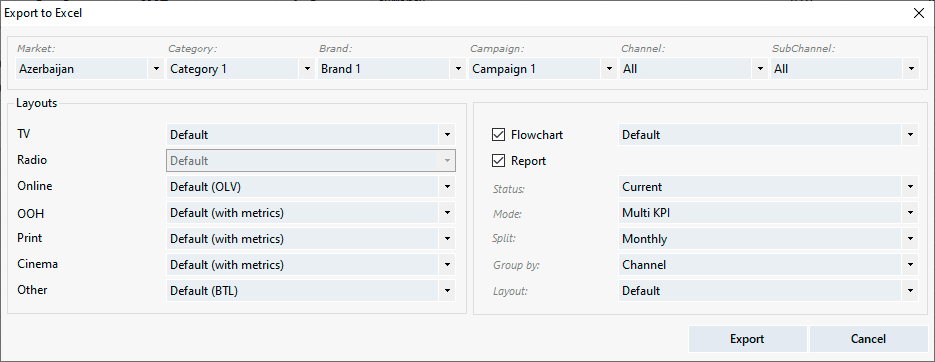
In the Export to Excel dialog box, choose the market, category, brand, campaign, channel, or sub-channel you want to export (you can select All in each of them).
In the Layouts group of the dialog box, the selected or available media channels are activated, and you can choose the layout in which the plans should be exported from the drop-down lists.
If you need to export the flowchart or report as well, check the corresponding checkbox, select the layout for the flowchart, and configure the report settings.
An application file can be exported or imported into another application file. This is useful if you need to, for example, send part of the data to someone (not all data), or integrate part of the data received from someone into your file.
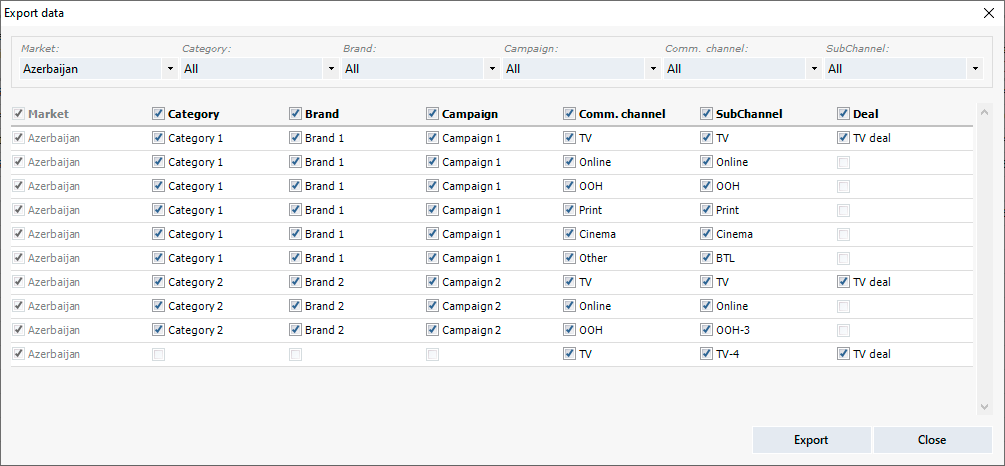
Exporting Data
Click the Export button on the application toolbar. In the Export data dialog box, select which data you need to export to a separate file: you can choose the market, category, brand, campaign, channel, and sub-channel from the drop-down lists, and additionally manage which data will be exported by checking/unchecking boxes in the table.
Then click the Export button in the dialog box, choose a location to save the file, enter a file name, and click OK.
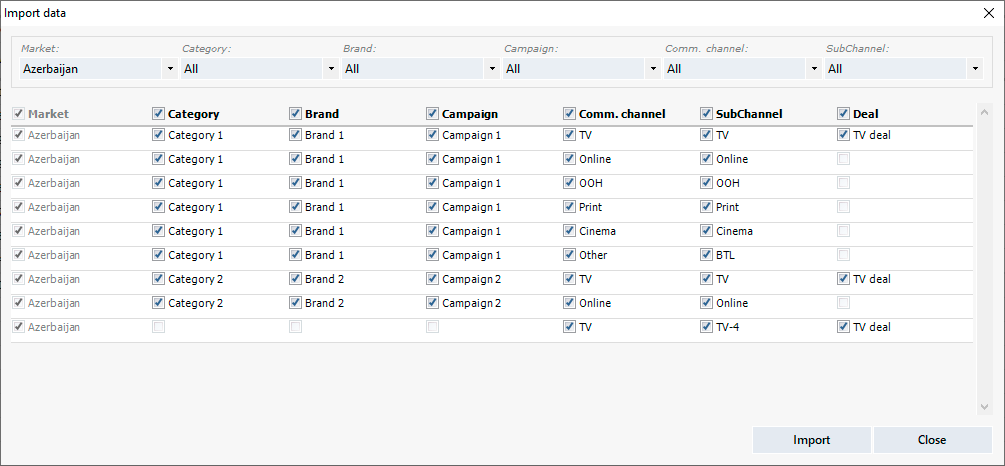
Importing Data
Importing data into the application file is done similarly. Click the Import button on the application toolbar. In the file open dialog box, select the desired file and click OK. In the dialog box, select the data to be imported and click OK.
The application has 4 pre-installed themes (color schemes) for media plans.
Users can also configure and save up to 3 custom themes by setting any desired colors for the main elements of media plans - one theme, for example, in the agency's corporate colors, and others as per clients' requests in their corporate colors.
In the application's menu bar, go to Settings and select Set custom theme.
In the Custom theme setting dialog box, choose the theme name (Custom 1, Custom 2, Custom 3) from the drop-down list. In the dialog box table, click on the name of the element whose color you want to set (e.g., Header, Main font, Auto-cell, etc.) and choose a color for the selected element.
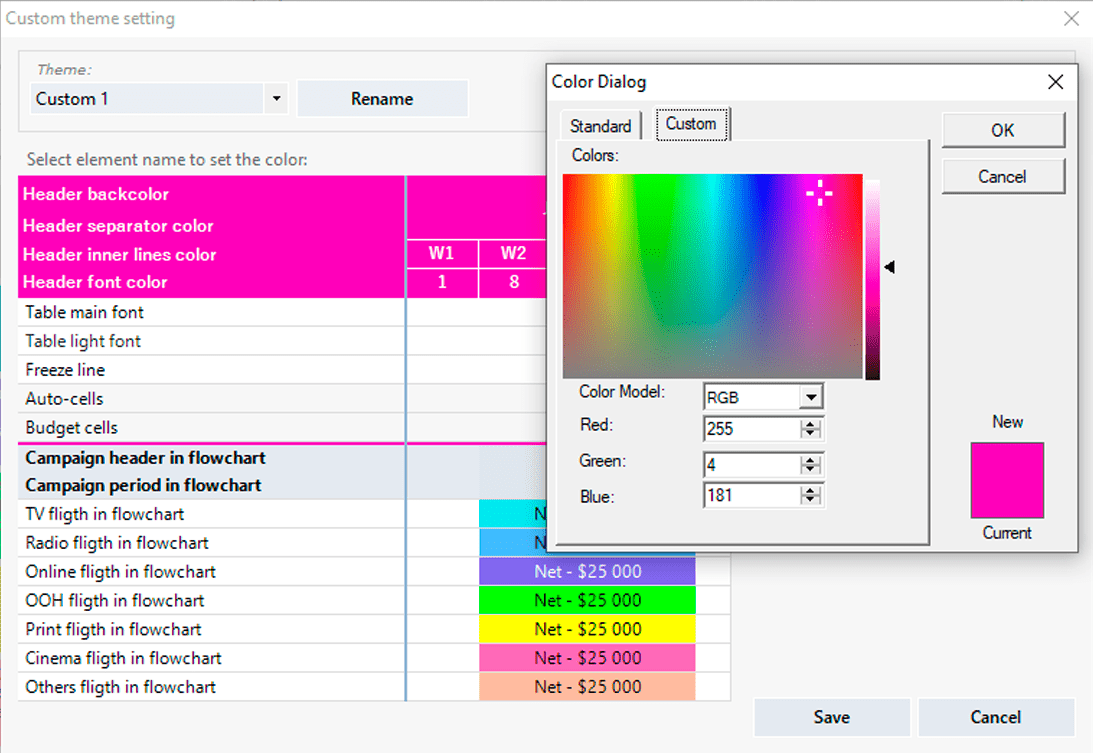
After finishing the edits, click Save.
You can select a theme by using the Theme button on the toolbar or the Theme option in the Settings menu in the menu bar. In both cases, a list of available themes will open, from which you can choose the desired one.
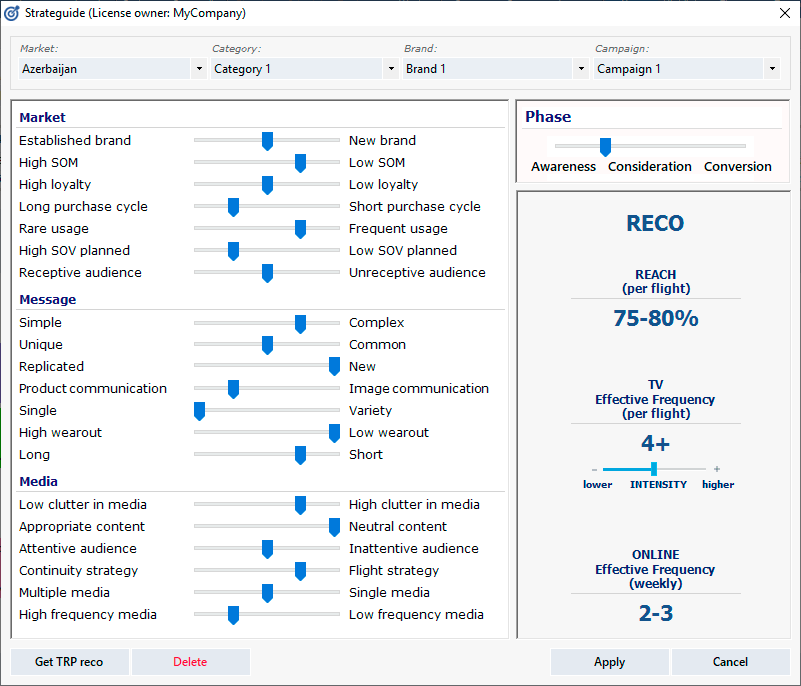
The application includes the strategic module Strateguide, which allows generating recommendations on the minimum necessary campaign (flight) reach and effective frequency for TV and online communication channels.
The user needs to evaluate three groups of criteria – Market (brand position and specifics), Message (creative features and its lifecycle stage), and Media (media channel characteristics, audience, placement strategy).
The phase of the marketing funnel targeted by the planned advertising campaign should also be determined (Awareness – Consideration – Conversion).
Based on the entered data, the application generates recommendations on reach and effective frequency.
The computational algorithm is based on the classic Ostrow matrix, adapted to consider modern trends in media consumption, audience behavior, and contemporary concepts of cross-platform media planning.
Additionally, during the development of the tool, numerous studies from global research companies and world leaders in the advertising and IT industries, available in open sources, were reviewed, summarized, and applied.
After definition of the effective frequency on TV, click Get TRP reco button.
In the opened window, click Import benchmark button and import reach benchmarks for a determined effective frequency from a pre-prepared Excel file.
Download a reach benchmark importing template with detailed guidance
After importing the benchmarks, the application will display the reach curves in the chart and generate recommendations for the minimum, maximum, and optimal (recommended) media weights level:
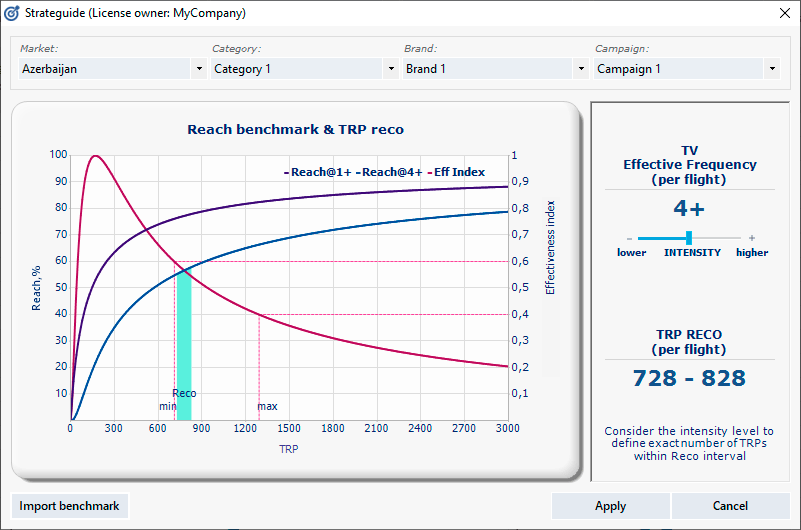
The recommended level has a fairly narrow interval. To determine the exact media weight within the recommended interval, take into account the Intensity indicator.
⚠ You should understand that the application recommendation of is not a "panacea" - the application provides general, scientifically proven recommendations based on numerous researches and studies and operating effectively in most cases, however, the specifics of each particular market should also be taken into account.